
Browsing Category
Uncategorized
616 posts
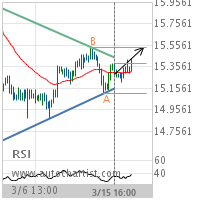
XAG/USD Target Level: 15.5350
Triangle identified at 15-Mar-2019 16:00 UTC. This pattern is still in the process of forming. Possible bullish price movement towards the resistance 15.5350 within the next 3 days. Supported by RSI below 40 Chart 4 hourPattern TriangleLength 103 CandlesIdentified 15-Mar-2019 16:00 UTC
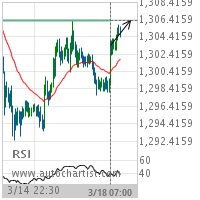
XAU/USD Target Level: 1306.2800
Approaching Resistance level of 1306.2800 identified at 18-Mar-2019 07:00 UTC Supported by RSI below 40 Chart 30 MinutesPattern ResistanceLength 150 CandlesIdentified 18-Mar-2019 07:00 UTC
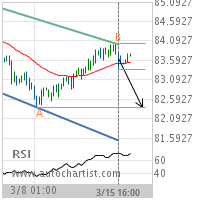
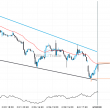
CAD/JPY Target Level: 82.3900
Channel Down identified at 15-Mar-2019 16:00 UTC. This pattern is still in the process of forming. Possible bearish price movement towards the support 82.3900 within the next 2 days. Supported by RSI above 60 Chart 4 hourPattern Channel DownLength 80 CandlesIdentified 15-Mar-2019 16:00 UTC
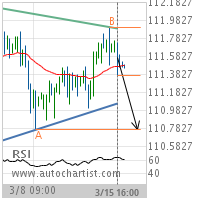
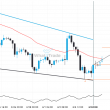
USD/JPY Target Level: 110.7680
Triangle identified at 15-Mar-2019 16:00 UTC. This pattern is still in the process of forming. Possible bearish price movement towards the support 110.7680 within the next 2 days. Supported by RSI above 60 Chart 4 hourPattern TriangleLength 76 CandlesIdentified 15-Mar-2019 16:00 UTC
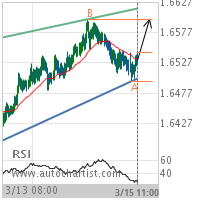
EUR/NZD Target Level: 1.6599
Rising Wedge identified at 15-Mar-2019 11:00 UTC. This pattern is still in the process of forming. Possible bullish price movement towards the resistance 1.6599 within the next 2 days. Supported by RSI below 40 Chart 30 MinutesPattern Rising WedgeLength 219 CandlesIdentified 15-Mar-2019 11:00 UTC
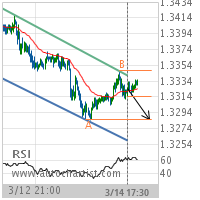
USD/CAD Target Level: 1.3285
Channel Down identified at 14-Mar-2019 17:30 UTC. This pattern is still in the process of forming. Possible bearish price movement towards the support 1.3285 within the next 2 days. Supported by RSI above 60 Chart 30 MinutesPattern Channel DownLength 201 CandlesIdentified 14-Mar-2019 17:30 UTC
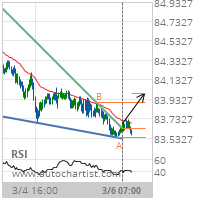
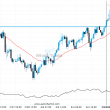
CAD/JPY Target Level: 83.9923
Falling Wedge has broken through the resistance line at 06-Mar-2019 07:00 UTC. Possible bullish price movement forecast for the next 2 days towards 83.9923. Supported by RSI below 40 Chart 30 MinutesPattern Falling WedgeLength 179 CandlesIdentified 06-Mar-2019 07:00 UTC
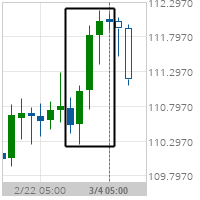
Big Movement CHF/JPY
CHF/JPY experienced a 1.11% bullish movement in the last 6 days. Chart DailyPattern Big MovementLength 5 CandlesIdentified 04-Mar-2019 05:00 UTC
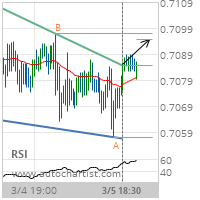
AUD/USD Target Level: 0.7094
Falling Wedge has broken through the resistance line at 05-Mar-2019 18:30 UTC. Possible bullish price movement forecast for the next 14 hours towards 0.7094. Supported by Upward sloping Moving Average Chart 30 MinutesPattern Falling WedgeLength 107 CandlesIdentified 05-Mar-2019 18:30 UTC
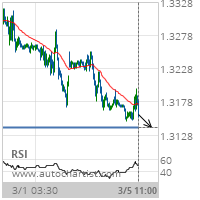
GBP/USD Target Level: 1.3140
Approaching Support level of 1.3140 identified at 05-Mar-2019 11:00 UTC Supported by Downward sloping Moving Average Chart 30 MinutesPattern SupportLength 244 CandlesIdentified 05-Mar-2019 11:00 UTC