
Browsing Category
Uncategorized
616 posts
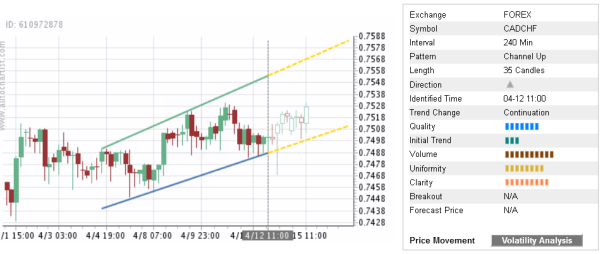
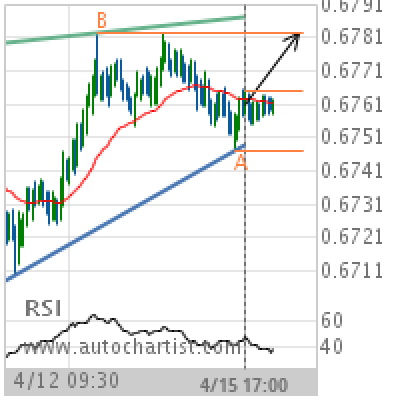
Trade of the Day: CAD/CHF
By: Dima Chernovolov CAD/CHF continues to rise inside the clear 4-hour Up Channel which was recently identified by Autochartist. Autochartist rates the quality of daily this Up Channel at the 7-bar level – which is the result of the slow Initial Trend (3 bars), significant Uniformity (8 bars) and near-maximum Clarity (9 bars). CAD/CHF is…
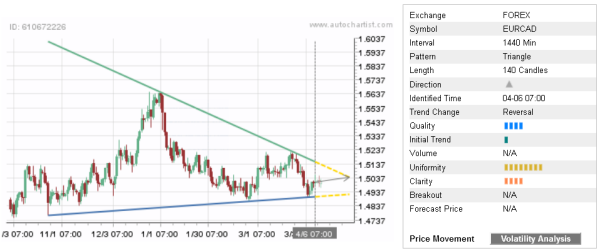
Trade of the Day: EUR/CAD
By: Dima Chernovolov EUR/CAD continues to rise inside the daily Triangle chart pattern which was previously identified by Autochartist. Autochartist rates the quality of this Triangle at the 4-bar level – which is the result of the slow Initial Trend (1 bar), significant Uniformity (8 bars) and below-average Clarity (4 bars). EUR/CAD is expected to…
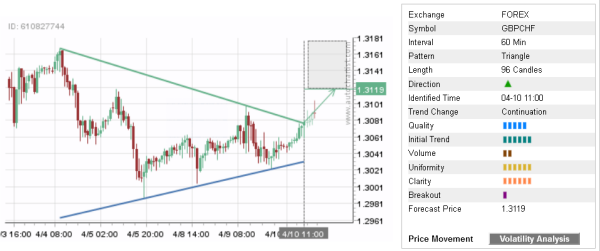
Trade of the Day: GBP/CHF
By: Dima Chernovolov GBP/CHF continues to rise after the recent breakout of the hourly Triangle chart pattern which was previously identified by Autochartist. Autochartist rates the quality of this Triangle at the 5-bar level – which is the result of the above average Initial Trend, Uniformity and strong Clarity (all rated at the 6 bar…
NZD/USD Target Level: 0.6782
Rising Wedge identified at 15-Apr-2019 17:00 UTC. This pattern is still in the process of forming. Possible bullish price movement towards the resistance 0.6782 within the next 19 hours. Supported by RSI below 40 Chart 30 MinutesPattern Rising WedgeLength 143 CandlesIdentified 15-Apr-2019 17:00 UTC
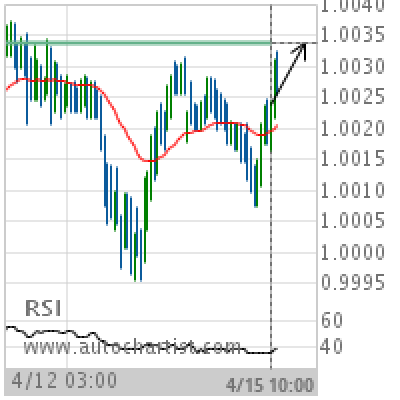
USD/CHF Target Level: 1.0033
Approaching Resistance level of 1.0033 identified at 15-Apr-2019 10:00 UTC Supported by RSI below 40 Chart 30 MinutesPattern ResistanceLength 135 CandlesIdentified 15-Apr-2019 10:00 UTC
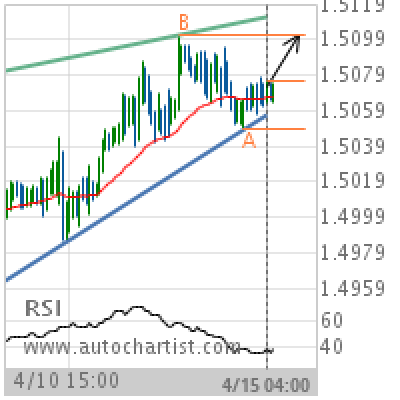
EUR/CAD Target Level: 1.5101
Rising Wedge identified at 15-Apr-2019 04:00 UTC. This pattern is still in the process of forming. Possible bullish price movement towards the resistance 1.5101 within the next 2 days. Supported by RSI below 40 Chart 1 hourPattern Rising WedgeLength 135 CandlesIdentified 15-Apr-2019 04:00 UTC
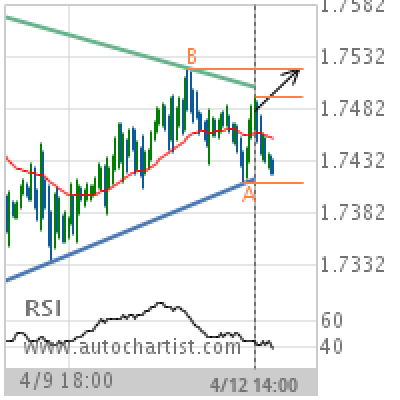
GBP/CAD Target Level: 1.7520
Triangle identified at 12-Apr-2019 14:00 UTC. This pattern is still in the process of forming. Possible bullish price movement towards the resistance 1.7520 within the next 2 days. Supported by RSI below 40 Chart 1 hourPattern TriangleLength 151 CandlesIdentified 12-Apr-2019 14:00 UTC
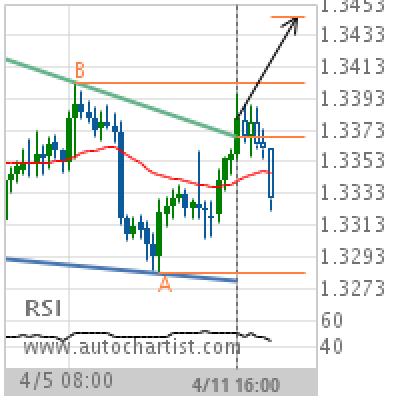
USD/CAD Target Level: 1.3444
Falling Wedge has broken through the resistance line at 11-Apr-2019 16:00 UTC. Possible bullish price movement forecast for the next 2 days towards 1.3444. Supported by Upward sloping Moving Average Chart 4 hourPattern Falling WedgeLength 61 CandlesIdentified 11-Apr-2019 16:00 UTC
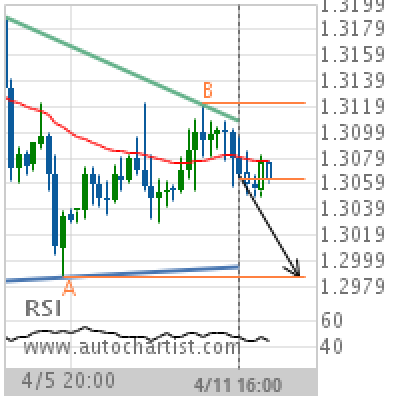
GBP/USD Target Level: 1.2986
Descending Triangle identified at 11-Apr-2019 16:00 UTC. This pattern is still in the process of forming. Possible bearish price movement towards the support 1.2986 within the next 2 days. Supported by Downward sloping Moving Average Chart 4 hourPattern Descending TriangleLength 56 CandlesIdentified 11-Apr-2019 16:00 UTC
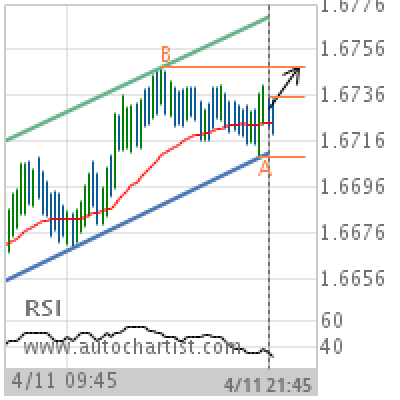
EUR/NZD Target Level: 1.6748
Channel Up identified at 11-Apr-2019 21:45 UTC. This pattern is still in the process of forming. Possible bullish price movement towards the resistance 1.6748 within the next 9 hours. Supported by RSI below 40 Chart 15 MinutesPattern Channel UpLength 106 CandlesIdentified 11-Apr-2019 21:45 UTC