
Browsing Category
Uncategorized
616 posts
Big Movement USD/CHF
USD/CHF experienced a 1.67% bearish movement in the last 11 days. Chart DailyPattern Big MovementLength 9 CandlesIdentified 10-Jun-2019 04:00 UTC
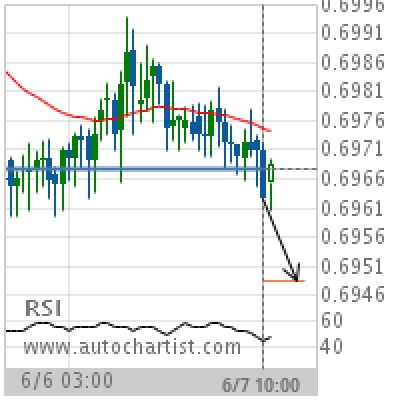
AUD/USD Target Level: 0.6949
Broke through Support level of 0.6968 at 07-Jun-2019 10:00 UTC Supported by Downward sloping Moving Average Chart 1 hourPattern SupportLength 69 CandlesIdentified 07-Jun-2019 10:00 UTC
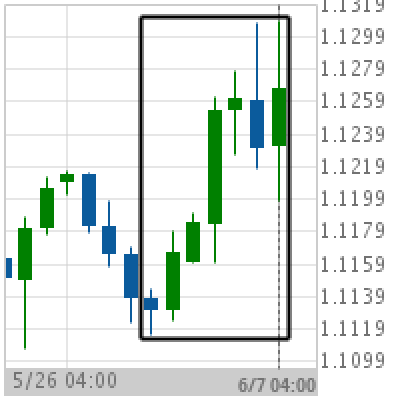
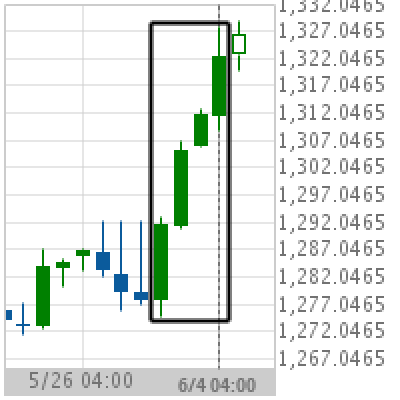
Big Movement EUR/USD
EUR/USD experienced a 1.16% bullish movement in the last 8 days. Chart DailyPattern Big MovementLength 7 CandlesIdentified 07-Jun-2019 04:00 UTC
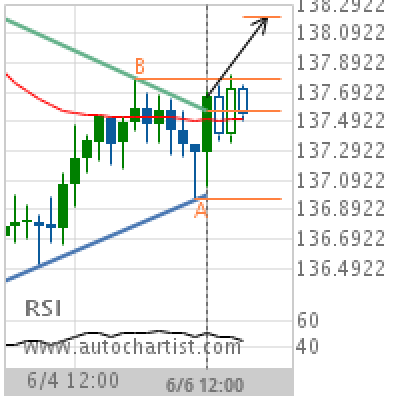
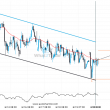
GBP/JPY Target Level: 138.2024
Triangle has broken through the resistance line at 06-Jun-2019 12:00 UTC. Possible bullish price movement forecast for the next day towards 138.2024. Supported by Upward sloping Moving Average Chart 4 hourPattern TriangleLength 30 CandlesIdentified 06-Jun-2019 12:00 UTC
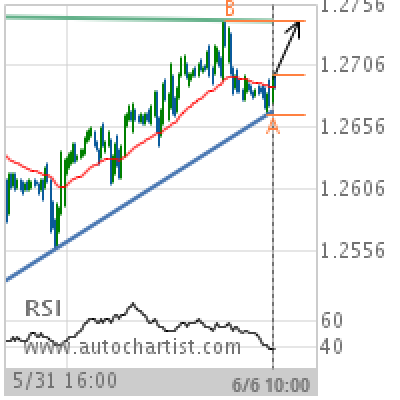
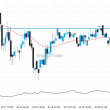
GBP/USD Target Level: 1.2743
Ascending Triangle identified at 06-Jun-2019 10:00 UTC. This pattern is still in the process of forming. Possible bullish price movement towards the resistance 1.2743 within the next 3 days. Supported by RSI below 40 Chart 1 hourPattern Ascending TriangleLength 195 CandlesIdentified 06-Jun-2019 10:00 UTC
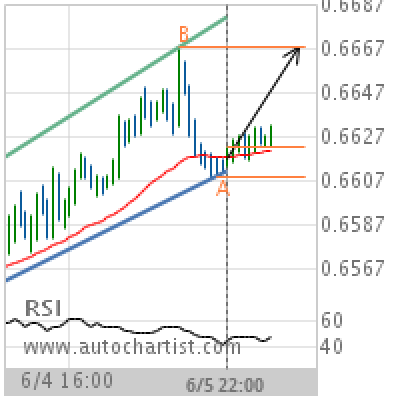
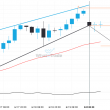
NZD/USD Target Level: 0.6667
Channel Up identified at 05-Jun-2019 22:00 UTC. This pattern is still in the process of forming. Possible bullish price movement towards the resistance 0.6667 within the next 15 hours. Supported by Upward sloping Moving Average Chart 1 hourPattern Channel UpLength 70 CandlesIdentified 05-Jun-2019 22:00 UTC
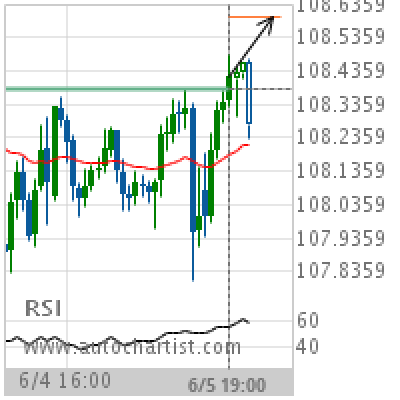
USD/JPY Target Level: 108.5965
Broke through Resistance level of 108.3820 at 05-Jun-2019 19:00 UTC Supported by Upward sloping Moving Average Chart 1 hourPattern ResistanceLength 61 CandlesIdentified 05-Jun-2019 19:00 UTC
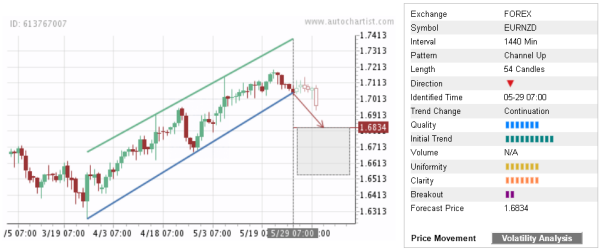
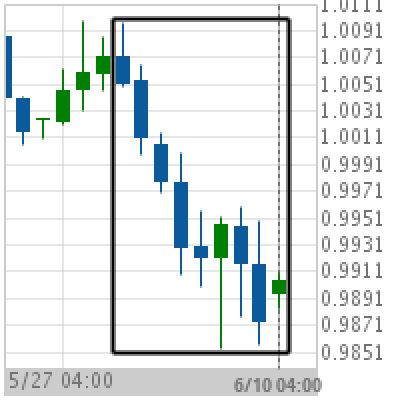
Trade of the Day: EUR/NZD
By: Dima Chernovolov EUR/NZD recently broke the daily Up Channel chart pattern which was previously identified by Autochartist. Autochartist rates the quality of this Up Channel at the 7-bar level – which is the result of the sharp Initial Trend (10 bars) and strong Uniformity and Clarity (8 bars). EUR/NZD is expected to fall further…
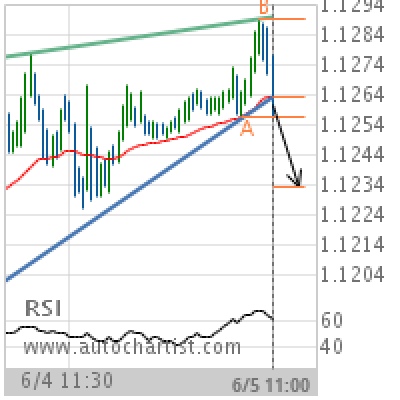
EUR/USD Target Level: 1.1233
Rising Wedge has broken through the support line at 05-Jun-2019 11:00 UTC. Possible bearish price movement forecast for the next 17 hours towards 1.1233. Supported by RSI above 60 Chart 30 MinutesPattern Rising WedgeLength 104 CandlesIdentified 05-Jun-2019 11:00 UTC
Big Movement XAU/USD
XAU/USD experienced a 3.48% bullish movement in the last 5 days. Chart DailyPattern Big MovementLength 4 CandlesIdentified 04-Jun-2019 04:00 UTC