
Browsing Category
Uncategorized
616 posts
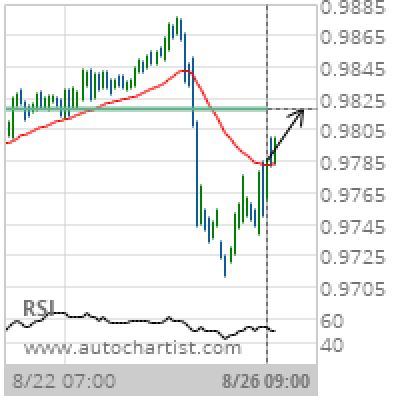
USD/CHF Target Level: 0.9818
Approaching Resistance level of 0.9818 identified at 26-Aug-2019 09:00 UTC Supported by Upward sloping Moving Average Chart 1 hourPattern ResistanceLength 109 CandlesIdentified 26-Aug-2019 09:00 UTC
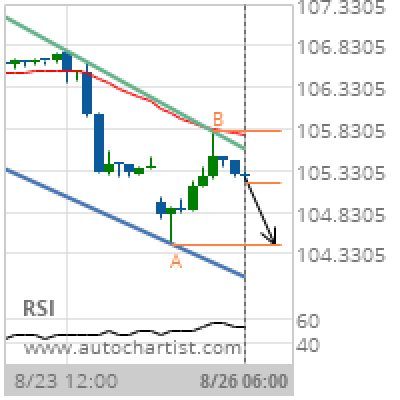
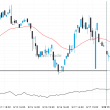
USD/JPY Target Level: 104.4460
Channel Down identified at 26-Aug-2019 06:00 UTC. This pattern is still in the process of forming. Possible bearish price movement towards the support 104.4460 within the next 13 hours. Supported by Downward sloping Moving Average Chart 1 hourPattern Channel DownLength 40 CandlesIdentified 26-Aug-2019 06:00 UTC
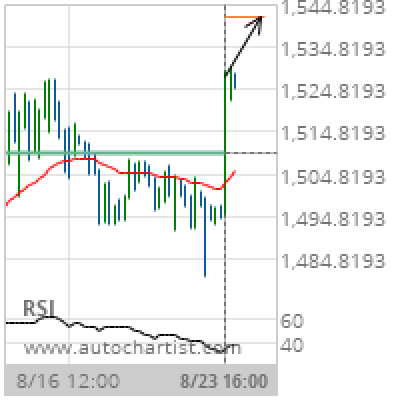
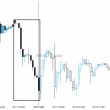
XAU/USD Target Level: 1541.7660
Broke through Resistance level of 1509.9301 at 23-Aug-2019 16:00 UTC Supported by RSI below 40 Chart 4 hourPattern ResistanceLength 75 CandlesIdentified 23-Aug-2019 16:00 UTC
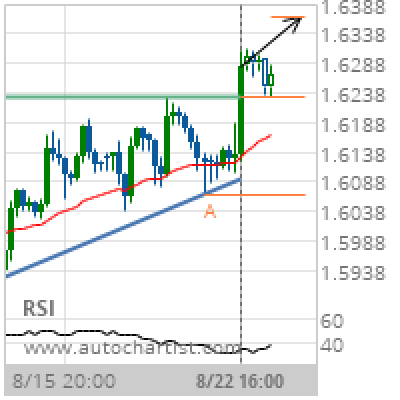
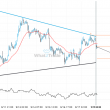
GBP/CAD Target Level: 1.6366
Ascending Triangle has broken through the resistance line at 22-Aug-2019 16:00 UTC. Possible bullish price movement forecast for the next 3 days towards 1.6366. Supported by RSI below 40 Chart 4 hourPattern Ascending TriangleLength 67 CandlesIdentified 22-Aug-2019 16:00 UTC
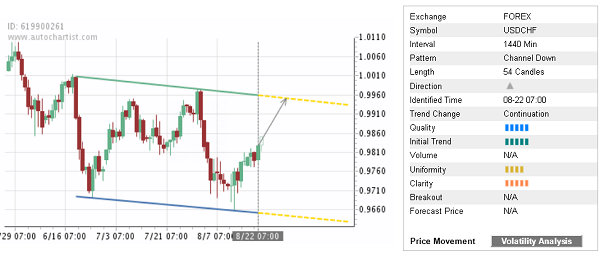
Trade of the Day: USD/CHF
By: Dima Chernovolov USD/CHF continues to rise inside the daily Down Channel chart pattern which was recently previously by Autochartist. Autochartist rates the quality of this Down Channel at the 5-bar level – which reflects the average Initial Trend (5 bars), lower Uniformity (4 bars) and medium Clarity (5 bars). USD/CHF is expected to rise…
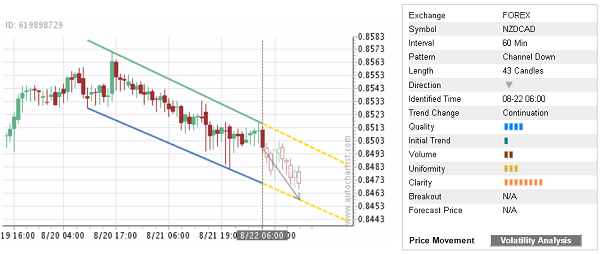
Trade of the Day: NZD/CAD
By: Dima Chernovolov NZD/CAD continues to fall inside the hourly Down Channel chart pattern which was identified previously by Autochartist. Autochartist rates the quality of this Down Channel at the 4-bar level – which is the result of the below-average Initial Trend (1 bar), lower Uniformity (3 bars) and strong Clarity (8 bars). NZD/CAD is…
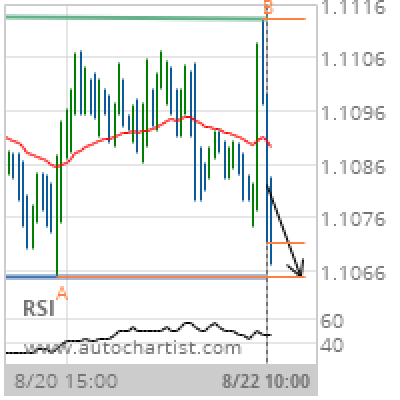
EUR/USD Target Level: 1.1065
Rectangle identified at 22-Aug-2019 10:00 UTC. This pattern is still in the process of forming. Possible bearish price movement towards the support 1.1065 within the next day. Supported by Downward sloping Moving Average Chart 1 hourPattern RectangleLength 93 CandlesIdentified 22-Aug-2019 10:00 UTC
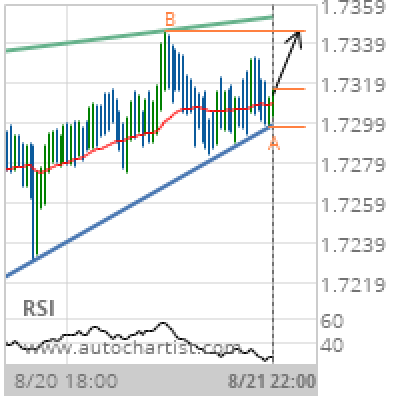
EUR/NZD Target Level: 1.7346
Rising Wedge identified at 21-Aug-2019 22:00 UTC. This pattern is still in the process of forming. Possible bullish price movement towards the resistance 1.7346 within the next 20 hours. Supported by RSI below 40 Chart 30 MinutesPattern Rising WedgeLength 121 CandlesIdentified 21-Aug-2019 22:00 UTC
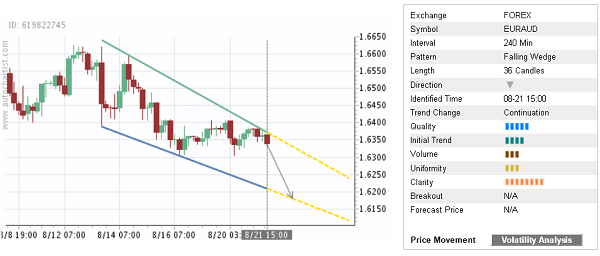
Trade of the Day: EUR/AUD
By: Dima Chernovolov EUR/AUD continues to fall inside the 4-hour Falling Wedge chart pattern which was identified previously by Autochartist. Autochartist rates the quality of this Falling Wedge at the 5-bar level – which is the result of the below-average Initial Trend (4 bars), lower Uniformity (3 bars) and significant Clarity (8 bars). EUR/AUD is…
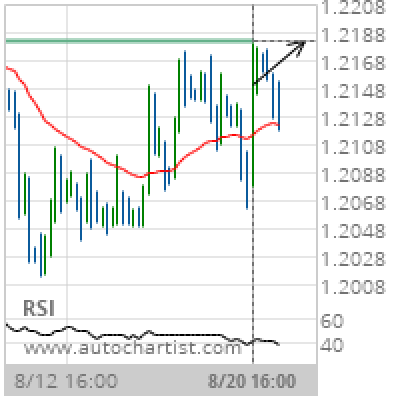
GBP/USD Target Level: 1.2183
Approaching Resistance level of 1.2183 identified at 20-Aug-2019 16:00 UTC Supported by RSI below 40 Chart 4 hourPattern ResistanceLength 81 CandlesIdentified 20-Aug-2019 16:00 UTC