


Browsing Category
Uncategorized
616 posts
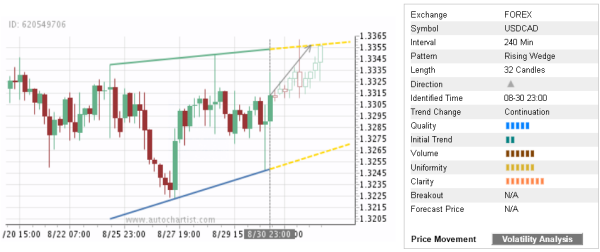
Trade of the Day: USD/CAD
By: Dima Chernovolov USD/CAD continues to rise inside the 4-hour Rising Wedge chart pattern which was identified previously by Autochartist. Autochartist measures the quality of this Rising Wedge at the 5-bar level – which reflects the slow Initial Trend (2 bars), above-average Uniformity (6 bars) and strong Clarity (8 bars). USD/CAD is expected to rise…
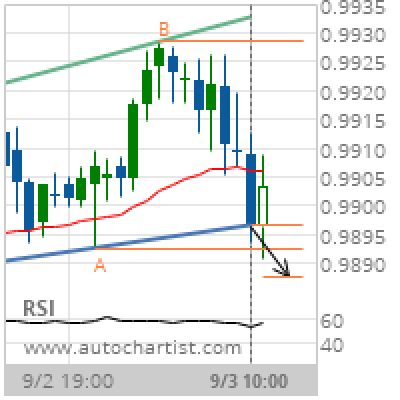
USD/CHF Target Level: 0.9888
Channel Up has broken through the support line at 03-Sep-2019 10:00 UTC. Possible bearish price movement forecast for the next 10 hours towards 0.9888. Supported by Downward sloping Moving Average Chart 1 hourPattern Channel UpLength 34 CandlesIdentified 03-Sep-2019 10:00 UTC
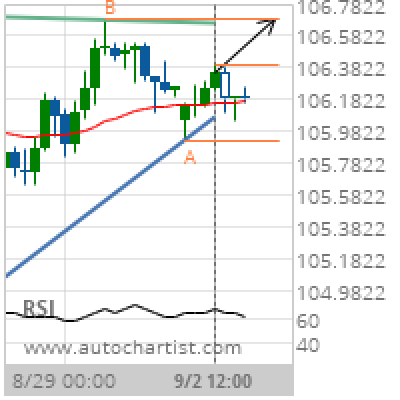
USD/JPY Target Level: 106.6820
Ascending Triangle identified at 02-Sep-2019 12:00 UTC. This pattern is still in the process of forming. Possible bullish price movement towards the resistance 106.6820 within the next day. Supported by Upward sloping Moving Average Chart 4 hourPattern Ascending TriangleLength 37 CandlesIdentified 02-Sep-2019 12:00 UTC
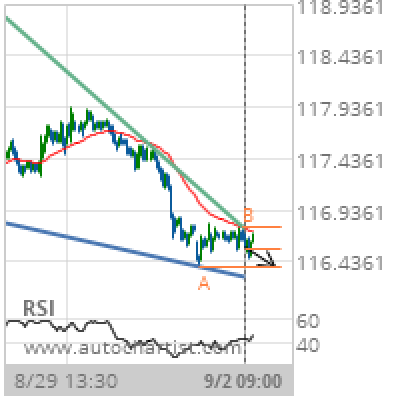
EUR/JPY Target Level: 116.3890
Falling Wedge identified at 02-Sep-2019 09:00 UTC. This pattern is still in the process of forming. Possible bearish price movement towards the support 116.3890 within the next day. Supported by Downward sloping Moving Average Chart 30 MinutesPattern Falling WedgeLength 197 CandlesIdentified 02-Sep-2019 09:00 UTC
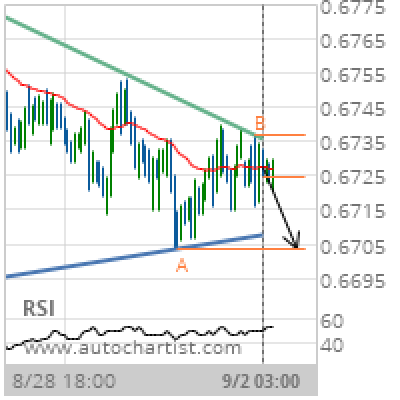
AUD/USD Target Level: 0.6704
Triangle identified at 02-Sep-2019 03:00 UTC. This pattern is still in the process of forming. Possible bearish price movement towards the support 0.6704 within the next 2 days. Supported by Downward sloping Moving Average Chart 1 hourPattern TriangleLength 124 CandlesIdentified 02-Sep-2019 03:00 UTC
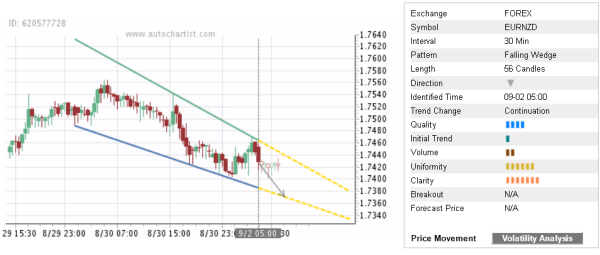
Trade of the Day: EUR/NZD
By: Dima Chernovolov EUR/NZD continues to fall inside the 30-minute Falling Wedge chart pattern which was identified previously by Autochartist. Autochartist measures the quality of this Falling Wedge at the 4-bar level – which reflects the slow Initial Trend (1 bar), above-average Uniformity (6 bars) and significant Clarity (7 bars). EUR/NZD is expected to fall…
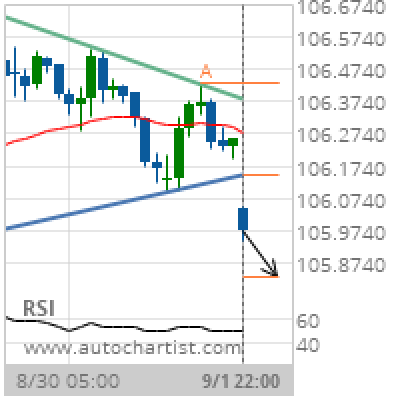
USD/JPY Target Level: 105.8333
Triangle has broken through the support line at 01-Sep-2019 22:00 UTC. Possible bearish price movement forecast for the next 12 hours towards 105.8333. Supported by Downward sloping Moving Average Chart 1 hourPattern TriangleLength 39 CandlesIdentified 01-Sep-2019 22:00 UTC
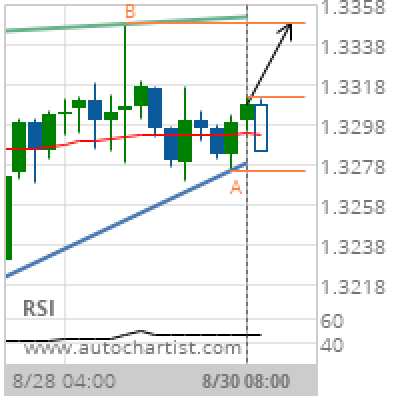
USD/CAD Target Level: 1.3348
Rising Wedge identified at 30-Aug-2019 08:00 UTC. This pattern is still in the process of forming. Possible bullish price movement towards the resistance 1.3348 within the next day. Supported by Upward sloping Moving Average Chart 4 hourPattern Rising WedgeLength 29 CandlesIdentified 30-Aug-2019 08:00 UTC
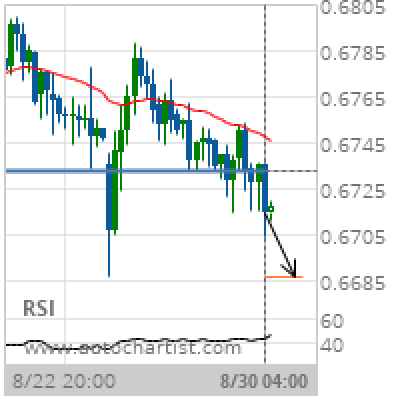
AUD/USD Target Level: 0.6687
Broke through Support level of 0.6732 at 30-Aug-2019 04:00 UTC Supported by Downward sloping Moving Average Chart 4 hourPattern SupportLength 72 CandlesIdentified 30-Aug-2019 04:00 UTC
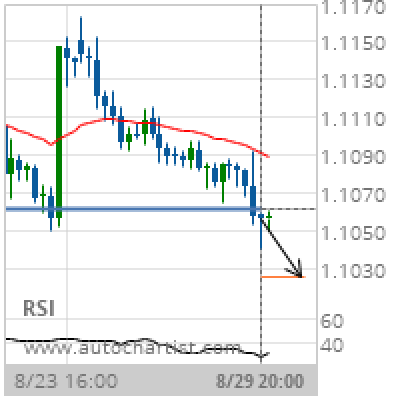
EUR/USD Target Level: 1.1026
Broke through Support level of 1.1062 at 29-Aug-2019 20:00 UTC Supported by Downward sloping Moving Average Chart 4 hourPattern SupportLength 58 CandlesIdentified 29-Aug-2019 20:00 UTC