


Browsing Category
Uncategorized
616 posts
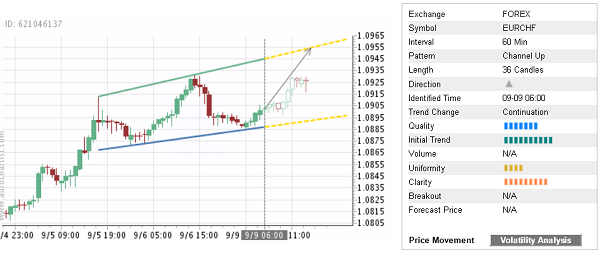
Trade of the Day: EUR/CHF
By: Dima Chernovolov EUR/CHF continues to rise inside the hourly Up Chanel chart pattern which was identified previously by Autochartist. Autochartist rates the quality of this Up Chanel at the 7-bar level – which reflects the sharp Initial Trend (10 bars), below-average Uniformity (4 bars) and strong Clarity (9 bars). EUR/CHF is expected to rise…
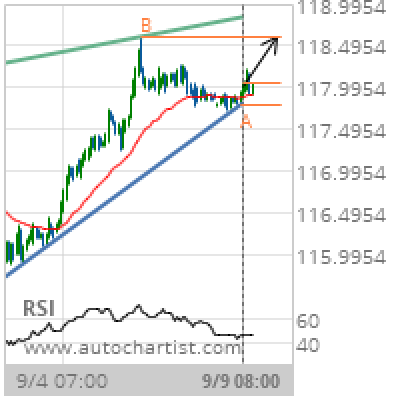
EUR/JPY Target Level: 118.6100
Rising Wedge identified at 09-Sep-2019 08:00 UTC. This pattern is still in the process of forming. Possible bullish price movement towards the resistance 118.6100 within the next 2 days. Supported by Upward sloping Moving Average Chart 1 hourPattern Rising WedgeLength 161 CandlesIdentified 09-Sep-2019 08:00 UTC
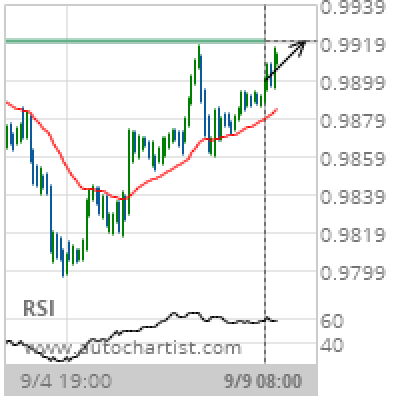
USD/CHF Target Level: 0.9919
Approaching Resistance level of 0.9919 identified at 09-Sep-2019 08:00 UTC Supported by Upward sloping Moving Average Chart 1 hourPattern ResistanceLength 134 CandlesIdentified 09-Sep-2019 08:00 UTC
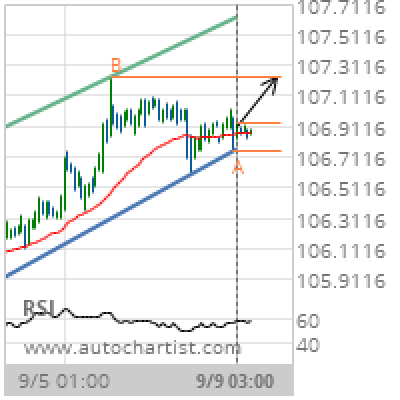
USD/JPY Target Level: 107.2320
Channel Up identified at 09-Sep-2019 03:00 UTC. This pattern is still in the process of forming. Possible bullish price movement towards the resistance 107.2320 within the next day. Supported by Upward sloping Moving Average Chart 1 hourPattern Channel UpLength 112 CandlesIdentified 09-Sep-2019 03:00 UTC
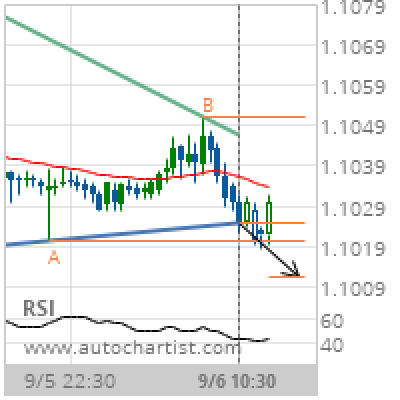
EUR/USD Target Level: 1.1012
Triangle has broken through the support line at 06-Sep-2019 10:30 UTC. Possible bearish price movement forecast for the next 7 hours towards 1.1012. Supported by Downward sloping Moving Average Chart 30 MinutesPattern TriangleLength 55 CandlesIdentified 06-Sep-2019 10:30 UTC
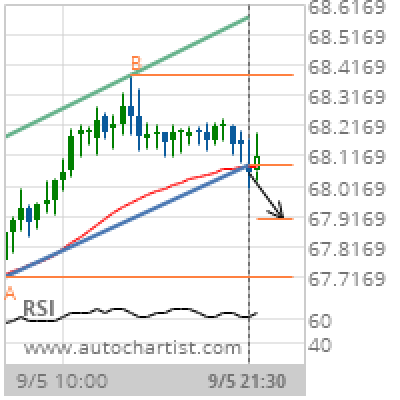
NZD/JPY Target Level: 67.9096
Channel Up has broken through the support line at 05-Sep-2019 21:30 UTC. Possible bearish price movement forecast for the next 7 hours towards 67.9096. Supported by RSI above 60 Chart 30 MinutesPattern Channel UpLength 43 CandlesIdentified 05-Sep-2019 21:30 UTC
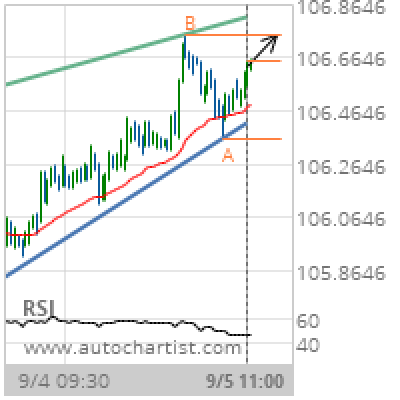
USD/JPY Target Level: 106.7510
Rising Wedge identified at 05-Sep-2019 11:00 UTC. This pattern is still in the process of forming. Possible bullish price movement towards the resistance 106.7510 within the next 19 hours. Supported by Upward sloping Moving Average Chart 30 MinutesPattern Rising WedgeLength 114 CandlesIdentified 05-Sep-2019 11:00 UTC
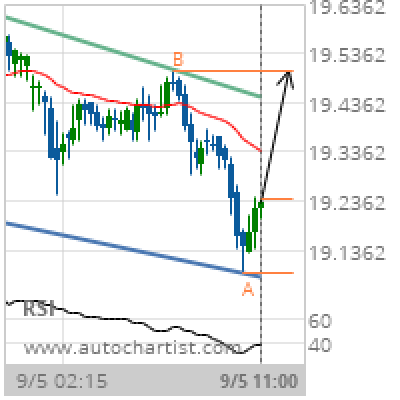
XAG/USD Target Level: 19.5020
Channel Down identified at 05-Sep-2019 11:00 UTC. This pattern is still in the process of forming. Possible bullish price movement towards the resistance 19.5020 within the next 6 hours. Supported by RSI below 40 Chart 15 MinutesPattern Channel DownLength 75 CandlesIdentified 05-Sep-2019 11:00 UTC
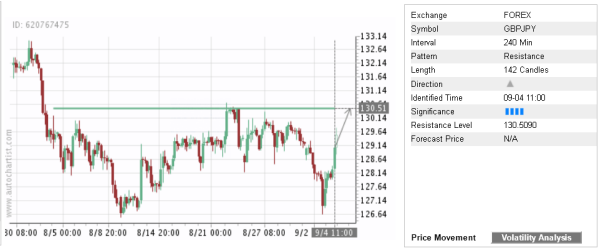
Trade of the Day: GBP/JPY
By: Dima Chernovolov GBP/JPY continues to rise in the direction of the key 4-hour Resistance Level 130.50 which was identified previously by Autochartist. Autochartist rates the Significance of this Resistance Level at the 4-bar level – which reflects four earlier price reversals for this price level. GBP/JPY is expected to rise further toward the Resistance…
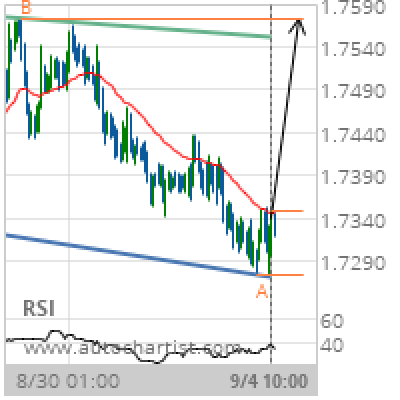
EUR/NZD Target Level: 1.7573
Channel Down identified at 04-Sep-2019 10:00 UTC. This pattern is still in the process of forming. Possible bullish price movement towards the resistance 1.7573 within the next 2 days. Supported by RSI below 40 Chart 1 hourPattern Channel DownLength 179 CandlesIdentified 04-Sep-2019 10:00 UTC