


Browsing Category
Uncategorized
616 posts
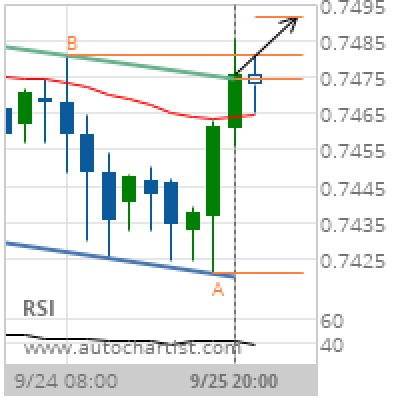
CAD/CHF Target Level: 0.7492
Channel Down has broken through the resistance line at 25-Sep-2019 20:00 UTC. Possible bullish price movement forecast for the next 21 hours towards 0.7492. Supported by RSI below 40 Chart 4 hourPattern Channel DownLength 20 CandlesIdentified 25-Sep-2019 20:00 UTC
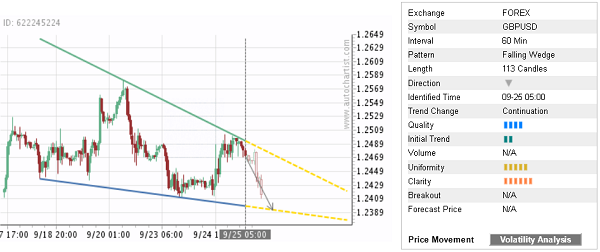
Trade of the Day: GBP/USD
By: Dima Chernovolov GBP/USD continues to fall inside the hourly Falling Wedge chart pattern which was identified recently by Autochartist. Autochartist rates the quality of this Falling Wedge at the 4-bar level – which reflects the slow Initial Trend (2 bars), average Uniformity (5 bars) and higher Clarity (6 bars). GBP/USD is expected to fall…
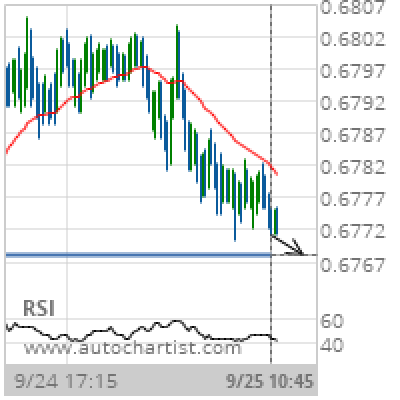
AUD/USD Target Level: 0.6768
Approaching Support level of 0.6768 identified at 25-Sep-2019 10:45 UTC Supported by Downward sloping Moving Average Chart 15 MinutesPattern SupportLength 152 CandlesIdentified 25-Sep-2019 10:45 UTC
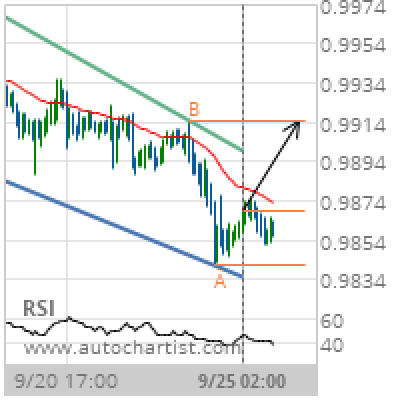
USD/CHF Target Level: 0.9914
Channel Down identified at 25-Sep-2019 02:00 UTC. This pattern is still in the process of forming. Possible bullish price movement towards the resistance 0.9914 within the next day. Supported by RSI below 40 Chart 1 hourPattern Channel DownLength 129 CandlesIdentified 25-Sep-2019 02:00 UTC
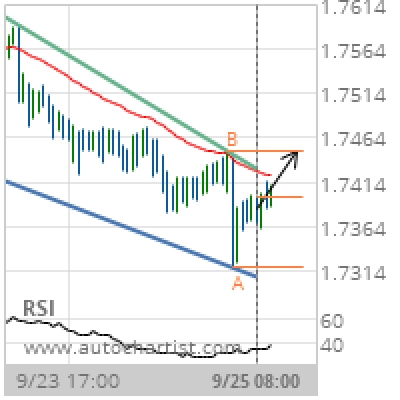
EUR/NZD Target Level: 1.7449
Falling Wedge identified at 25-Sep-2019 08:00 UTC. This pattern is still in the process of forming. Possible bullish price movement towards the resistance 1.7449 within the next day. Supported by RSI below 40 Chart 1 hourPattern Falling WedgeLength 87 CandlesIdentified 25-Sep-2019 08:00 UTC
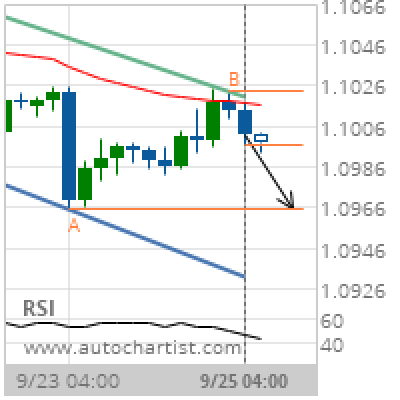
EUR/USD Target Level: 1.0965
Channel Down identified at 25-Sep-2019 04:00 UTC. This pattern is still in the process of forming. Possible bearish price movement towards the support 1.0965 within the next day. Supported by Downward sloping Moving Average Chart 4 hourPattern Channel DownLength 27 CandlesIdentified 25-Sep-2019 04:00 UTC
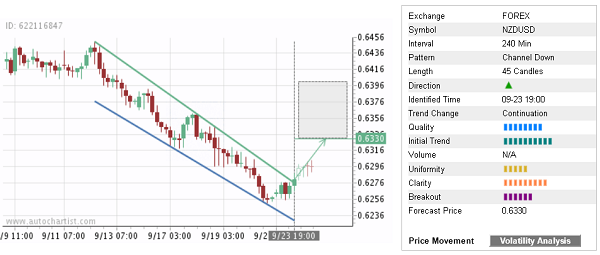
Trade of the Day: NZD/USD
By: Dima Chernovolov NZD/USD recently broke the 4-hour Down Channel chart pattern which was identified recently by Autochartist. Autochartist rates the quality of this Down Channel at the 8-bar level – which reflects the sharp Initial Trend (10 bars), average Uniformity (5 bars) and significant Clarity (8 bars). NZD/USD is expected to rise further toward…
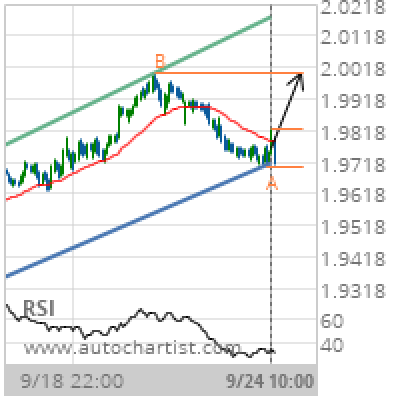
GBP/NZD Target Level: 2.0001
Channel Up identified at 24-Sep-2019 10:00 UTC. This pattern is still in the process of forming. Possible bullish price movement towards the resistance 2.0001 within the next 3 days. Supported by RSI below 40 Chart 1 hourPattern Channel UpLength 189 CandlesIdentified 24-Sep-2019 10:00 UTC
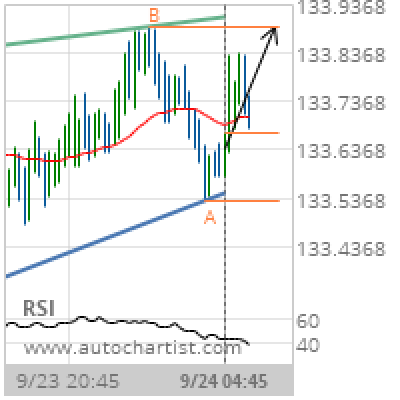
GBP/JPY Target Level: 133.8900
Rising Wedge identified at 24-Sep-2019 04:45 UTC. This pattern is still in the process of forming. Possible bullish price movement towards the resistance 133.8900 within the next 5 hours. Supported by RSI below 40 Chart 15 MinutesPattern Rising WedgeLength 75 CandlesIdentified 24-Sep-2019 04:45 UTC
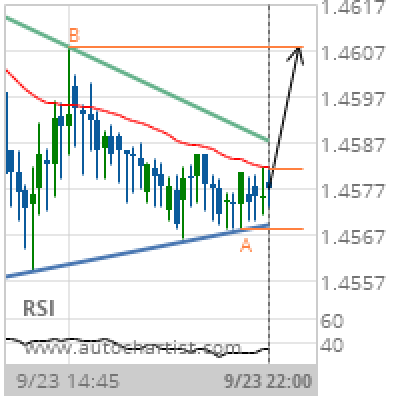
EUR/CAD Target Level: 1.4608
Triangle identified at 23-Sep-2019 22:00 UTC. This pattern is still in the process of forming. Possible bullish price movement towards the resistance 1.4608 within the next 5 hours. Supported by RSI below 40 Chart 15 MinutesPattern TriangleLength 63 CandlesIdentified 23-Sep-2019 22:00 UTC