


Browsing Category
Uncategorized
616 posts
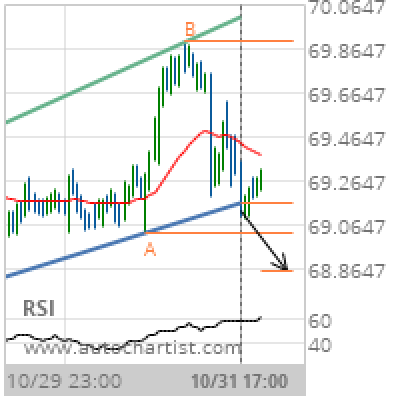
NZD/JPY Target Level: 68.8570
Channel Up has broken through the support line at 31-Oct-2019 17:00 UTC. Possible bearish price movement forecast for the next day towards 68.8570. Supported by RSI above 60 Chart 1 hourPattern Channel UpLength 94 CandlesIdentified 31-Oct-2019 17:00 UTC
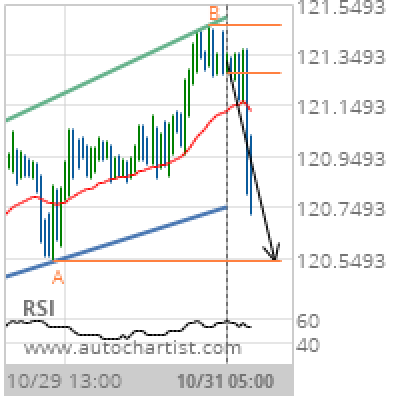
EUR/JPY Target Level: 120.5400
Channel Up identified at 31-Oct-2019 05:00 UTC. This pattern is still in the process of forming. Possible bearish price movement towards the support 120.5400 within the next day. Supported by Downward sloping Moving Average Chart 1 hourPattern Channel UpLength 92 CandlesIdentified 31-Oct-2019 05:00 UTC
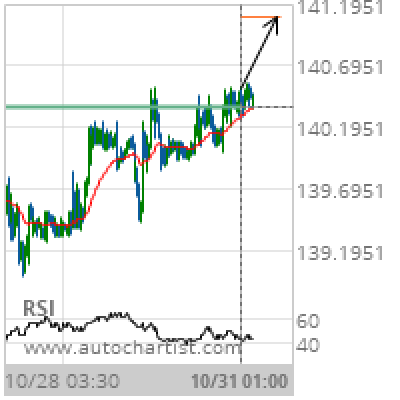
GBP/JPY Target Level: 141.0901
Broke through Resistance level of 140.3660 at 31-Oct-2019 01:00 UTC Supported by Upward sloping Moving Average Chart 30 MinutesPattern ResistanceLength 307 CandlesIdentified 31-Oct-2019 01:00 UTC
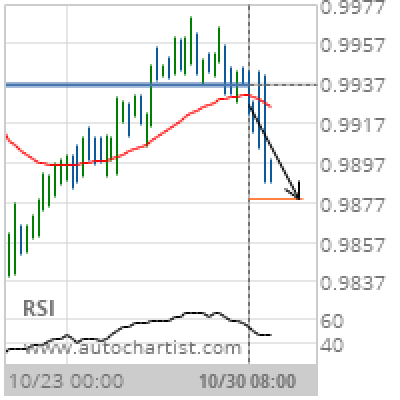
USD/CHF Target Level: 0.9879
Broke through Support level of 0.9936 at 30-Oct-2019 08:00 UTC Supported by Downward sloping Moving Average Chart 4 hourPattern SupportLength 73 CandlesIdentified 30-Oct-2019 08:00 UTC
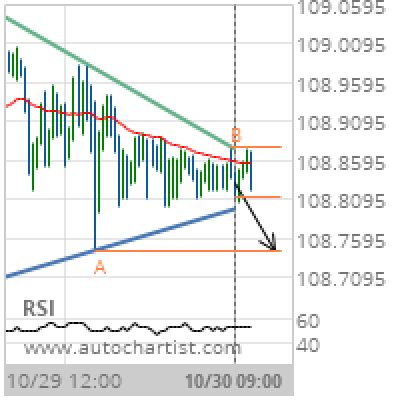
USD/JPY Target Level: 108.7440
Triangle identified at 30-Oct-2019 09:00 UTC. This pattern is still in the process of forming. Possible bearish price movement towards the support 108.7440 within the next 14 hours. Supported by Downward sloping Moving Average Chart 30 MinutesPattern TriangleLength 95 CandlesIdentified 30-Oct-2019 09:00 UTC
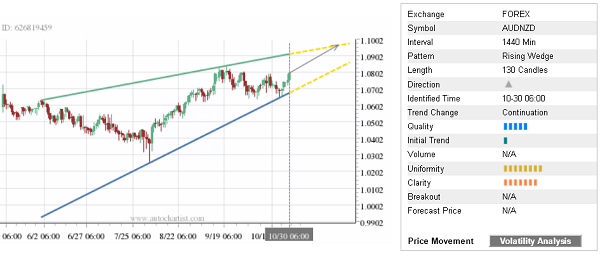
Trade of the Day: AUD/NZD
By: Dima Chernovolov AUD/NZD continues to rise inside the daily Rising Wedge chart pattern which was identified previously by Autochartist. Autochartist rates the quality of this Rising Wedge at the 5-bar level – which is the result of the slow Initial Trend (1 bar), strong Uniformity (8 bars) and significant Clarity (7 bars). AUD/NZD is…
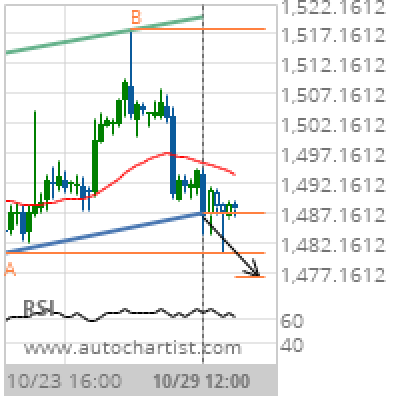
XAU/USD Target Level: 1476.6403
Channel Up has broken through the support line at 29-Oct-2019 12:00 UTC. Possible bearish price movement forecast for the next 2 days towards 1476.6403. Supported by RSI above 60 Chart 4 hourPattern Channel UpLength 54 CandlesIdentified 29-Oct-2019 12:00 UTC
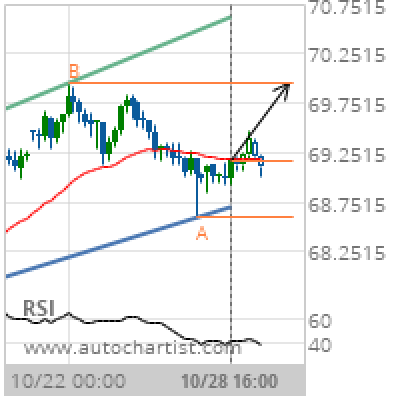
NZD/JPY Target Level: 69.9510
Channel Up identified at 28-Oct-2019 16:00 UTC. This pattern is still in the process of forming. Possible bullish price movement towards the resistance 69.9510 within the next 3 days. Supported by RSI below 40 Chart 4 hourPattern Channel UpLength 68 CandlesIdentified 28-Oct-2019 16:00 UTC
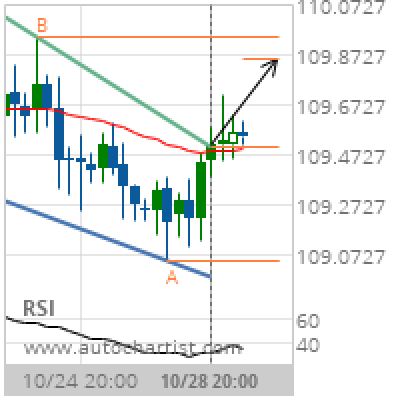
CHF/JPY Target Level: 109.8507
Falling Wedge has broken through the resistance line at 28-Oct-2019 20:00 UTC. Possible bullish price movement forecast for the next day towards 109.8507. Supported by RSI below 40 Chart 4 hourPattern Falling WedgeLength 33 CandlesIdentified 28-Oct-2019 20:00 UTC
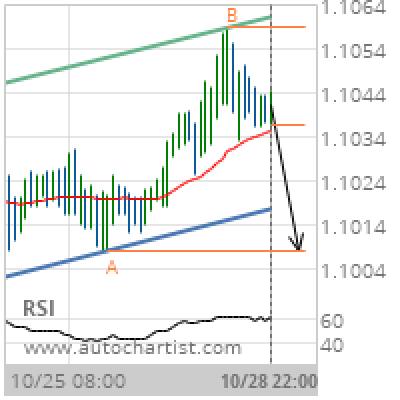
EUR/CHF Target Level: 1.1008
Channel Up identified at 28-Oct-2019 22:00 UTC. This pattern is still in the process of forming. Possible bearish price movement towards the support 1.1008 within the next day. Supported by RSI above 60 Chart 1 hourPattern Channel UpLength 84 CandlesIdentified 28-Oct-2019 22:00 UTC