


Browsing Category
Uncategorized
616 posts
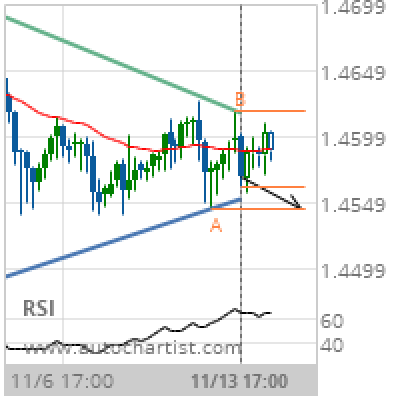
EUR/CAD Target Level: 1.4544
Triangle identified at 13-Nov-2019 17:00 UTC. This pattern is still in the process of forming. Possible bearish price movement towards the support 1.4544 within the next 3 days. Supported by RSI above 60 Chart 4 hourPattern TriangleLength 69 CandlesIdentified 13-Nov-2019 17:00 UTC
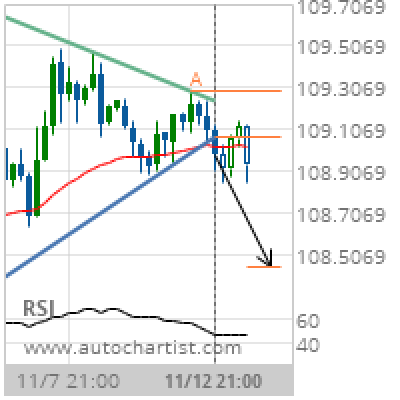
USD/JPY Target Level: 108.4437
Triangle has broken through the support line at 12-Nov-2019 21:00 UTC. Possible bearish price movement forecast for the next 2 days towards 108.4437. Supported by Downward sloping Moving Average Chart 4 hourPattern TriangleLength 45 CandlesIdentified 12-Nov-2019 21:00 UTC
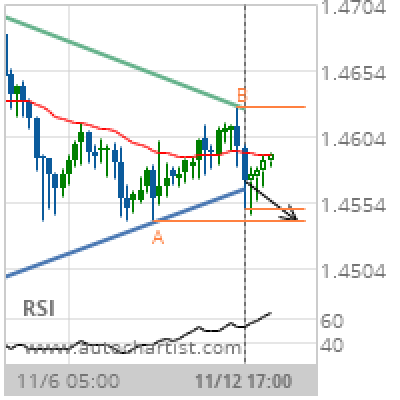
EUR/CAD Target Level: 1.4539
Triangle identified at 12-Nov-2019 17:00 UTC. This pattern is still in the process of forming. Possible bearish price movement towards the support 1.4539 within the next 3 days. Supported by RSI above 60 Chart 4 hourPattern TriangleLength 63 CandlesIdentified 12-Nov-2019 17:00 UTC
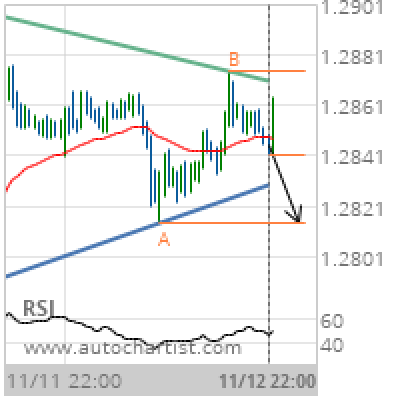
GBP/USD Target Level: 1.2814
Triangle identified at 12-Nov-2019 22:00 UTC. This pattern is still in the process of forming. Possible bearish price movement towards the support 1.2814 within the next 17 hours. Supported by Downward sloping Moving Average Chart 30 MinutesPattern TriangleLength 103 CandlesIdentified 12-Nov-2019 22:00 UTC
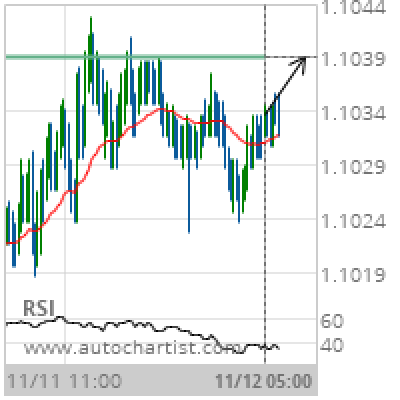
EUR/USD Target Level: 1.1039
Approaching Resistance level of 1.1039 identified at 12-Nov-2019 05:00 UTC Supported by RSI below 40 Chart 15 MinutesPattern ResistanceLength 158 CandlesIdentified 12-Nov-2019 05:00 UTC
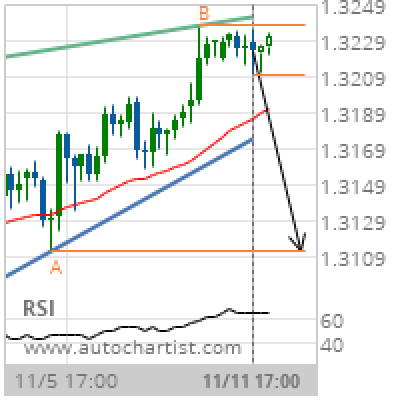
USD/CAD Target Level: 1.3112
Rising Wedge identified at 11-Nov-2019 17:00 UTC. This pattern is still in the process of forming. Possible bearish price movement towards the support 1.3112 within the next 3 days. Supported by RSI above 60 Chart 4 hourPattern Rising WedgeLength 56 CandlesIdentified 11-Nov-2019 17:00 UTC
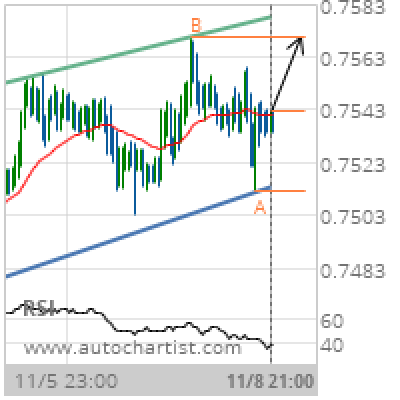
CAD/CHF Target Level: 0.7571
Channel Up identified at 08-Nov-2019 21:00 UTC. This pattern is still in the process of forming. Possible bullish price movement towards the resistance 0.7571 within the next 2 days. Supported by RSI below 40 Chart 1 hourPattern Channel UpLength 151 CandlesIdentified 08-Nov-2019 21:00 UTC
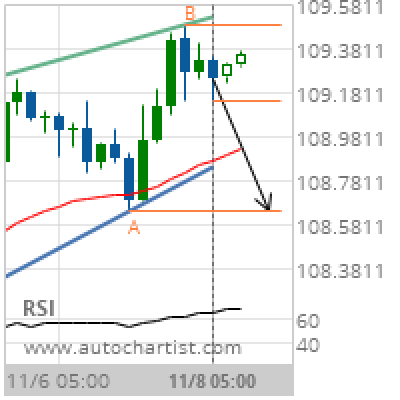
USD/JPY Target Level: 108.6410
Pennant identified at 08-Nov-2019 05:00 UTC. This pattern is still in the process of forming. Possible bearish price movement towards the support 108.6410 within the next day. Supported by RSI above 60 Chart 4 hourPattern PennantLength 28 CandlesIdentified 08-Nov-2019 05:00 UTC
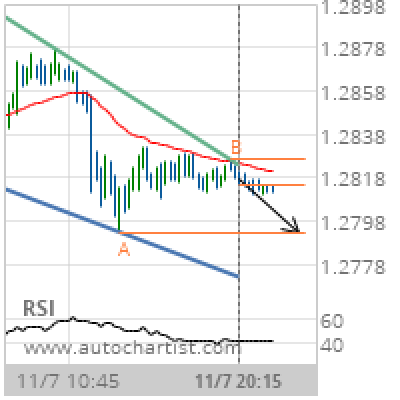
GBP/USD Target Level: 1.2793
Falling Wedge identified at 07-Nov-2019 20:15 UTC. This pattern is still in the process of forming. Possible bearish price movement towards the support 1.2793 within the next 6 hours. Supported by Downward sloping Moving Average Chart 15 MinutesPattern Falling WedgeLength 88 CandlesIdentified 07-Nov-2019 20:15 UTC
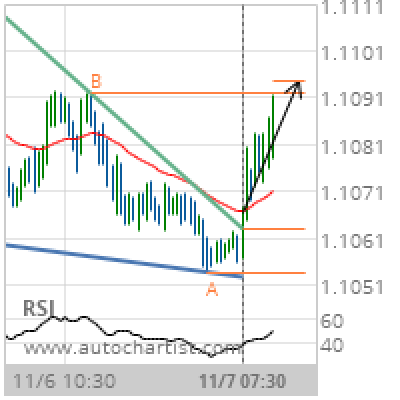
EUR/USD Target Level: 1.1095
Falling Wedge has broken through the resistance line at 07-Nov-2019 07:30 UTC. Possible bullish price movement forecast for the next 12 hours towards 1.1095. Supported by Upward sloping Moving Average Chart 30 MinutesPattern Falling WedgeLength 94 CandlesIdentified 07-Nov-2019 07:30 UTC