Browsing Category
Uncategorized
616 posts
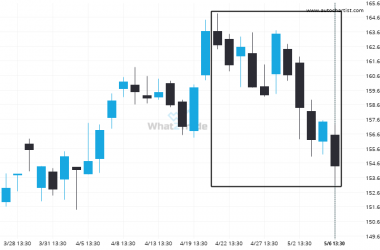
Procter & Gamble Co. moves lower to 154.37 in the last 16 days.
A movement of 5.1% over 16 days on Procter & Gamble Co. doesn’t go unnoticed. You may start…
“Trade of the day” Monthly Report – February 2022
Below are the performance statistics of our “Trade of the Day” website posts. The posts can be found at this location: https://trader.autochartist.com/category/market-analysis/ Accuracy – the quantity of posts that reached their forecast price. Total Forecast Pips – the cumulative number of pips reached by correct forecasts Total Drawdown Pips – the cumulative maximum drawdown shown before…
“Trade of the day” Monthly Report – January 2022
Below are the performance statistics of our “Trade of the Day” website posts. The posts can be found at this location: https://trader.autochartist.com/category/market-analysis/ Accuracy – the quantity of posts that reached their forecast price. Total Forecast Pips – the cumulative number of pips reached by correct forecasts Total Drawdown Pips – the cumulative maximum drawdown shown before…
“Trade of the day” Monthly Report – December 2021
Below are the performance statistics of our “Trade of the Day” website posts. The posts can be found at this location: https://trader.autochartist.com/category/market-analysis/ Accuracy – the quantity of posts that reached their forecast price. Total Forecast Pips – the cumulative number of pips reached by correct forecasts Total Drawdown Pips – the cumulative maximum drawdown shown before…
“Trade of the day” Monthly Report – November 2021
Below are the performance statistics of our “Trade of the Day” website posts. The posts can be found at this location: https://trader.autochartist.com/category/market-analysis/ Accuracy – the quantity of posts that reached their forecast price. Total Forecast Pips – the cumulative number of pips reached by correct forecasts Total Drawdown Pips – the cumulative maximum drawdown shown before…
“Trade of the day” Monthly Report – September 2021
Below are the performance statistics of our “Trade of the Day” website posts. The posts can be found at this location: https://trader.autochartist.com/category/market-analysis/ Accuracy – the quantity of posts that reached their forecast price. Total Forecast Pips – the cumulative number of pips reached by correct forecasts Total Drawdown Pips – the cumulative maximum drawdown shown before…
“Trade of the day” Monthly Report – August 2021
Below are the performance statistics of our “Trade of the Day” website posts. The posts can be found at this location: https://trader.autochartist.com/category/market-analysis/ Accuracy – the quantity of posts that reached their forecast price. Total Forecast Pips – the cumulative number of pips reached by correct forecasts Total Drawdown Pips – the cumulative maximum drawdown shown before…
“Trade of the day” Monthly Report – July 2021
Below are the performance statistics of our “Trade of the Day” website posts. The posts can be found at this location: https://trader.autochartist.com/category/market-analysis/ Accuracy – the quantity of posts that reached their forecast price. Total Forecast Pips – the cumulative number of pips reached by correct forecasts Total Drawdown Pips – the cumulative maximum drawdown shown before…
“Trade of the day” Monthly Report – June 2021
Below are the performance statistics of our “Trade of the Day” website posts. The posts can be found at this location: https://trader.autochartist.com/category/market-analysis/ Accuracy – the quantity of posts that reached their forecast price. Total Forecast Pips – the cumulative number of pips reached by correct forecasts Total Drawdown Pips – the cumulative maximum drawdown shown before…


