


Browsing Category
Global Indices
7095 posts
NAS 100 is signaling a possible trend reversal on the intraday charts with price not breaching support.
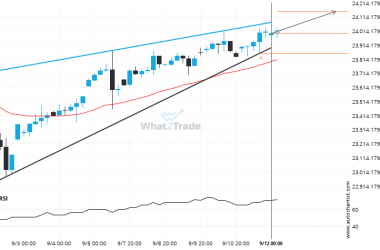
NAS 100 is heading towards the resistance line of a Rising Wedge. If this movement continues, the price…
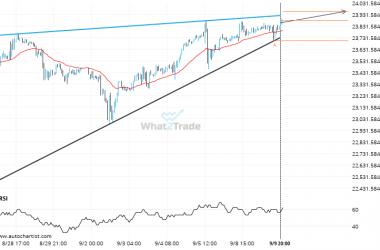
If DAX 40 touches 23544.0000 it may be time to take action.
DAX 40 is en route to a very important line that will be a definite deciding factor of…
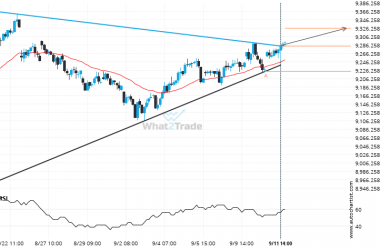
FTSE 100 breakout from a Triangle trade setup. Will it continue this trend to hit the target price?
This trade setup on FTSE 100 is formed by a period of consolidation; a period in which the…
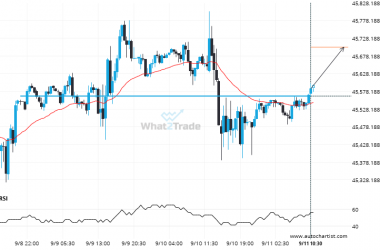
Big movement possible on DOW 30 after a breach of 45564.9883
The price of DOW 30 in heading in the direction of 45702.3633. Despite the recent breakout through 45564.9883…
Nikkei 225 is signaling a possible trend reversal on the intraday charts with price not breaching support.
Nikkei 225 was identified at around 43994.0 having recently rebounded of the support on the 4 hour data…
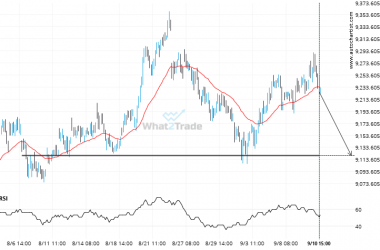
FTSE 100 is quickly approaching a very important level it has previously tested numerous times in the past
FTSE 100 is approaching a support line at 9120.0000. If it hits the support line, it may break…
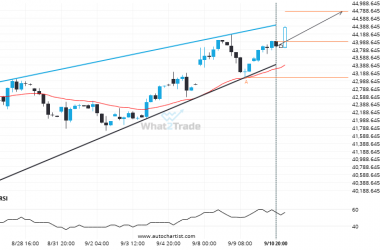
NAS 100 – approaching a resistance line that has been previously tested at least twice in the past
Emerging Rising Wedge detected on NAS 100 – the pattern is an emerging one and has not yet…

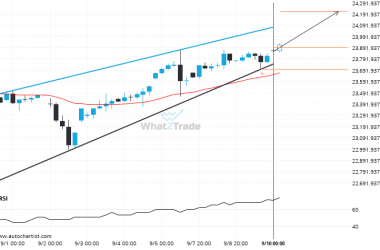
DOW 30 heading towards a price it has tested 3 times in the recent past.
DOW 30 is heading towards a line of 45773.9102. If this movement continues, the price of DOW 30…
NAS 100 – approaching a resistance line that has been previously tested at least twice in the past
Emerging Rising Wedge pattern in its final wave was identified on the NAS 100 1 hour chart. After…

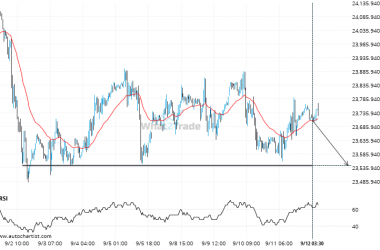
Nikkei 225 seems to be on its way to support – a possible opportunity?
The price of Nikkei 225 in heading back to the support area. It is possible that it will…