


Browsing Category
Global Indices
7095 posts
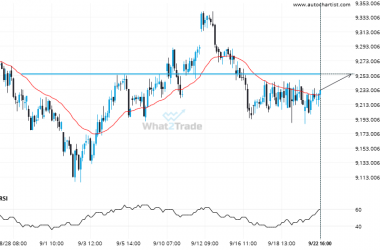
FTSE 100 heading towards a price it has tested 4 times in the recent past.
The movement of FTSE 100 towards 9254.6602 price line is yet another test of the line it reached…
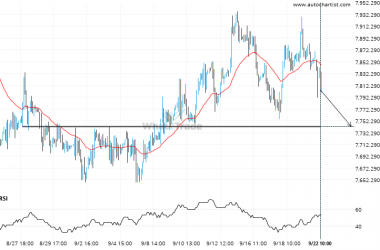
CAC 40 is signaling a possible trend reversal on the intraday charts with price not breaching support.
Emerging Ascending Triangle pattern in its final wave was identified on the CAC 40 30 Minutes chart. After…
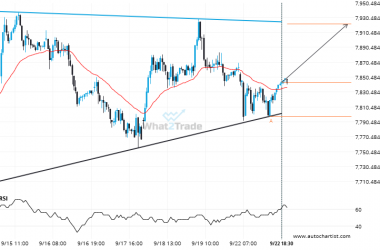
If you’re long CAC 40 you should be aware of the rapidly approaching level of 7742.7002
A strong support level has been identified at 7742.7002 on the 1 hour CAC 40 chart. CAC 40…
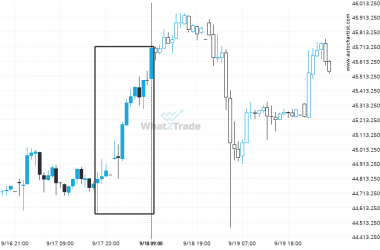
A very large move was recorded on Nikkei 225. The size of the shift is exceptional.
Nikkei 225 experienced an extremely large move that lasted 15. This ranks in the 96.0 percentile and is…
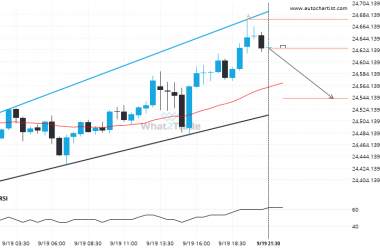
NAS 100 is approaching a support line of a Channel Up. It has touched this line numerous times in the last 19 hours.
An emerging Channel Up has been detected on NAS 100 on the 30 Minutes chart. There is a…
Nikkei 225 – approaching a price line that has been previously tested numerous times in the past
Nikkei 225 is moving towards a line of 44575.0000 which it has tested numerous times in the past.…
ASX 200 formed a Channel Down on the 1 hour chart. Retest of support in sight.
A Channel Down pattern was identified on ASX 200 at 8742.0, creating an expectation that it may move…
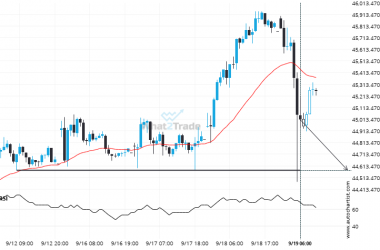
Rare bullish streak on the NAS 100 4 hour chart.
Rare candle sequence recorded on the NAS 100 4 hour chart, ending at 24497.3588.
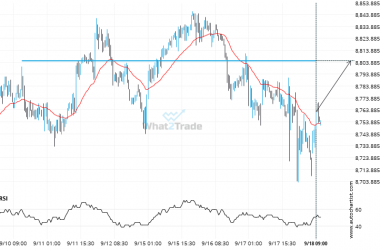
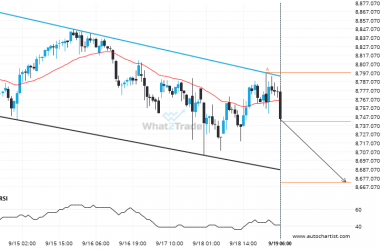
If you’re short ASX 200 you should be aware of the rapidly approaching level of 8805.2998
ASX 200 is heading towards a line of 8805.2998. If this movement continues, the price of ASX 200…
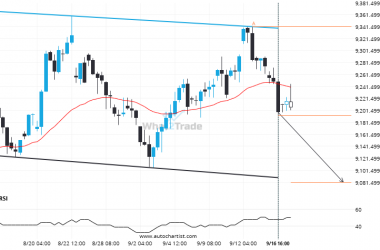
FTSE 100 is quickly approaching the support line of a Channel Down. We expect either a breakout through this line or a rebound.
Emerging Channel Down pattern in its final wave was identified on the FTSE 100 4 hour chart. After…