
Browsing Category
Global Indices
6656 posts
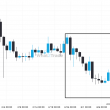
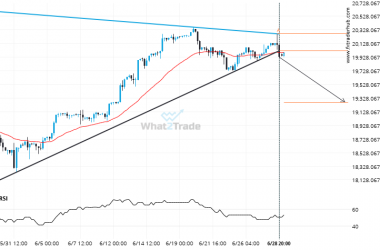
NAS100 – approaching a price line that has been previously tested numerous times in the past
NAS100 is moving towards a key resistance level at 20273.2500. NAS100 has previously tested this level 4 times…
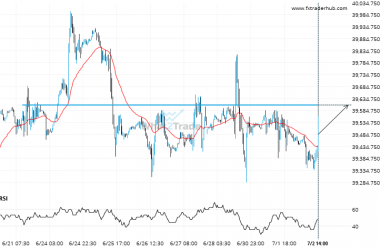
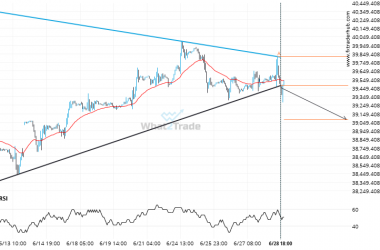
US30 – approaching a price line that has been previously tested numerous times in the past
A strong resistance level has been identified at 39607.0000 on the 30 Minutes US30 chart. US30 is likely…
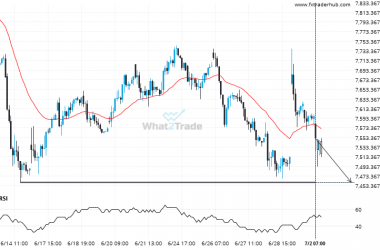
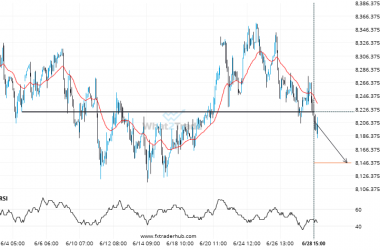
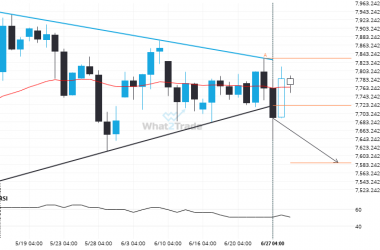
Important price line being approached by FRA40. This price has been tested numerous times before.
FRA40 is moving towards a key support level at 7460.0000. FRA40 has previously tested this level 3 times…
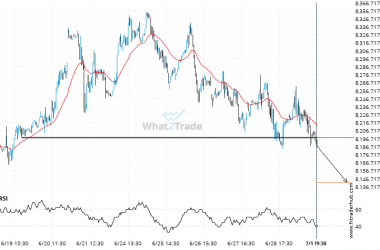
UK100 may be on a start of a new bearish trend after its breakout through this important support level
UK100 has breached the support line at 8197.5000. It may continue the bearish trend towards 8141.6499, or, it…
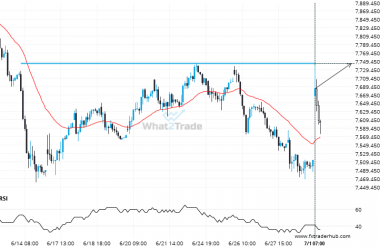
Bulls aim for 7701.6457 after the AUS200 triggered a bearish formation on the 1 hour chart
AUS200 has broken through the support line of a Triangle technical chart pattern. Because we have seen it…
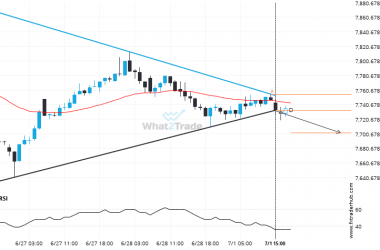
FRA40 likely to test 7744.0000 in the near future. Where to next?
FRA40 is moving towards a resistance line. Because we have seen it retrace from this level in the…
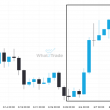
Interesting opportunity on NAS100 after breaking 20024.06651376147
The last 36 4 hour candles on NAS100 formed a Triangle pattern and broken out through the pattern…
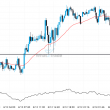
US30 has broken through support of a Triangle. It has touched this line at least twice in the last 17 days.
US30 has broken through the support line which it has tested twice in the past. We have seen…
It’s time to make a decision on UK100 – its recent breach of 8222.5000 could be a sign of a new trend to follow.
UK100 has broken through 8222.5000 which it has tested numerous times in the past. We have seen it…
Interesting opportunity on AUS200 after breaking 7721.666666666667
AUS200 has broken through a support line of a Triangle chart pattern. If this breakout holds true, we…