Browsing Category
Global Indices
6654 posts
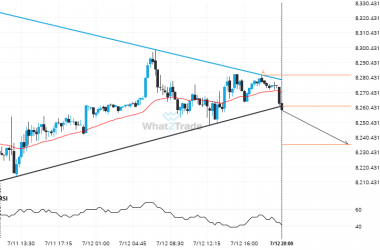
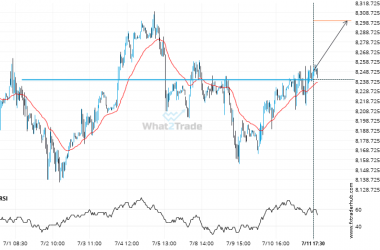
There is a possibility of a big movement on UK100 after a breach of the support
UK100 has broken through a support line of a Triangle and suggests a possible movement to 8235.3187 within…
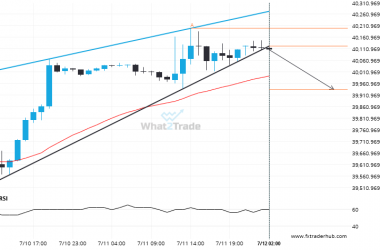
After testing support twice in the past, US30 has finally broken through. Can we expect a bearish trend to follow?
The breakout of US30 through the support line of a Rising Wedge could be a sign of the…
UK100 has broken through a resistance line. It has touched this line numerous times in the last 11 days.
UK100 has broken through 8240.0000 which it has tested numerous times in the past. We have seen it…
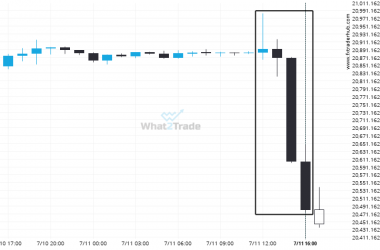
An unexpected large move has occurred on NAS100 1 hour chart! Is this a sign of something new? What can we expect?
NAS100 has experienced an extremely big movement in last 4 hours. It may continue the trend, but this…
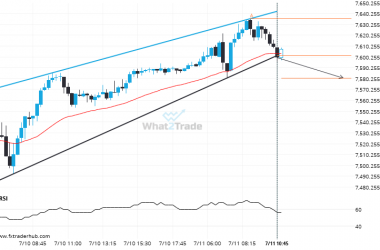
Breach of support could mean a start of a bearish trend on FRA40
This trade setup on FRA40 is formed by a period of consolidation; a period in which the price…
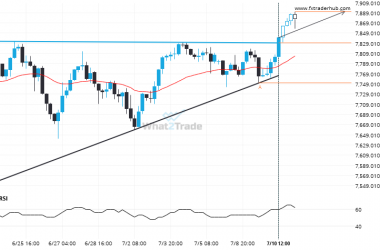
AUS200 breakout from a Ascending Triangle trade setup. Will it continue this trend to hit the target price?
Ascending Triangle pattern identified on AUS200 has broken through a resistance level with the price momentum continuing to…
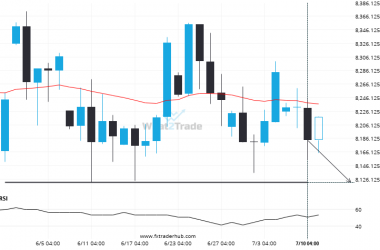
UK100 is approaching 8121.0000. We expect either a breakout through this line, or a rebound.
The price of UK100 in heading back to the support area. It is possible that it will struggle…
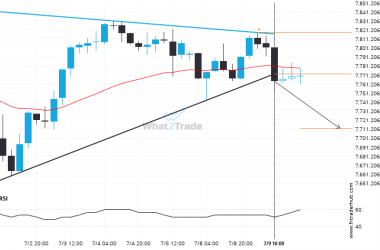
Breach of support could mean a start of a bearish trend on AUS200
AUS200 has broken through a support line of a Triangle chart pattern. If this breakout holds true, we…
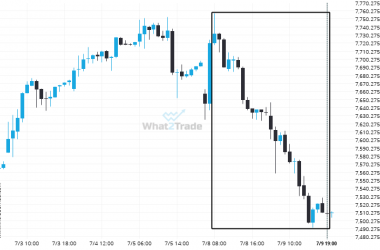
After experiencing a 2.88% bearish move in the space of 2 days, nobody knows where FRA40 is headed.
FRA40 has moved lower by 2.88% from 7731.5 to 7508.5 in the last 2 days.
After testing 20575.7500 numerous times, NAS100 is once again approaching this price point. Can we expect a bearish trend to follow?
NAS100 is en route to a very important line that will be a definite deciding factor of what…

