Browsing Category
Global Indices
6654 posts
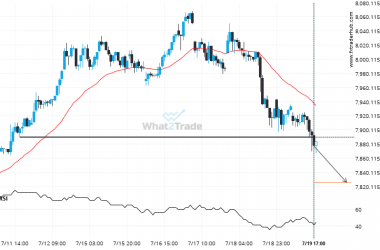
Important price line breached by AUS200. This price has been tested numerous times before.
AUS200 has breached the support line at 7890.0000. It may continue the bearish trend towards 7825.7002, or, it…
If you’re long UK100 you should be aware of the rapidly approaching level of 8135.5000
A strong support level has been identified at 8135.5000 on the 4 hour UK100 chart. UK100 is likely…
US30 moves lower to 40866.0 in the last 18 hours.
A movement of 1.52% over 18 hours on US30 doesn’t go unnoticed. You may start considering where it’s…
Important price line breached by NAS100. This price has been tested numerous times before.
NAS100 has broken through a line of 19933.7500. If this breakout holds true, we could see the price…
FRA40 heading towards a price it has tested 5 times in the recent past.
FRA40 is moving towards a support line. Because we have seen it retrace from this level in the…
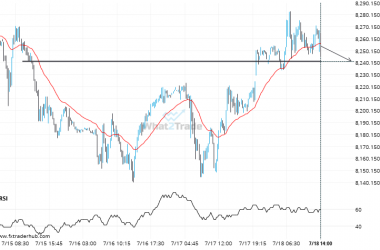
If you’re long UK100 you should be aware of the rapidly approaching level of 8241.0000
The price of UK100 in heading back to the support area. It is possible that it will struggle…
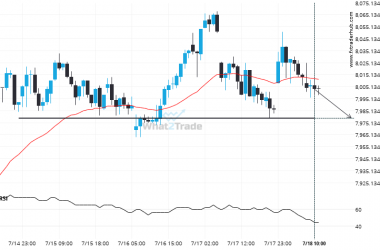
AUS200 is quickly approaching a very important level it has previously tested numerous times in the past
AUS200 is moving towards a support line. Because we have seen it retrace from this level in the…
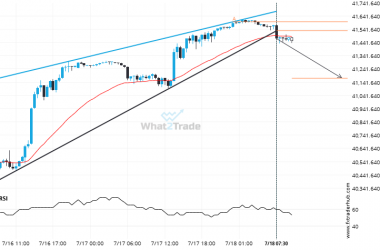
Breach of support could mean a start of a bearish trend on US30
Rising Wedge pattern identified on US30 has broken through a support level with the price momentum continuing to…
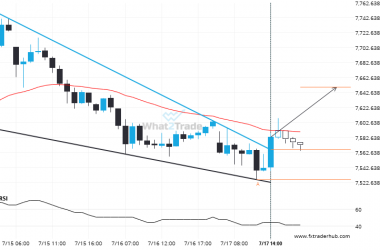
There is a possibility of a big movement on FRA40 after a breach of the resistance
You would be well advised to confirm the breakout that has just occurred – do you believe the…
NAS100 has broken through a level it has tested 4 times in the recent past.
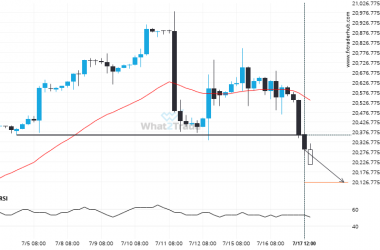
NAS100 has broken through a line of 20361.0000 and suggests a possible movement to 20123.2500 within the next…

