
Browsing Category
Global Indices
6644 posts
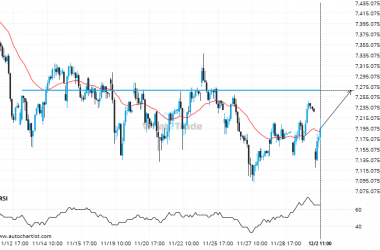
Will CAC 40 break through the resistance level it tested before?
CAC 40 is approaching a resistance line at 7267.1001. If it hits the resistance line, it may break…
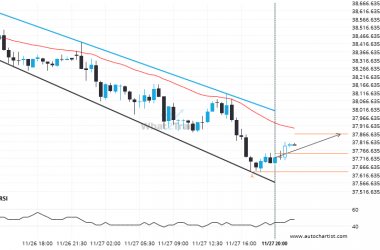
Resistance line breached by NAS 100. This price has been tested at least twice before.
NAS 100 has broken through a resistance line of a Triangle chart pattern. If this breakout holds true,…
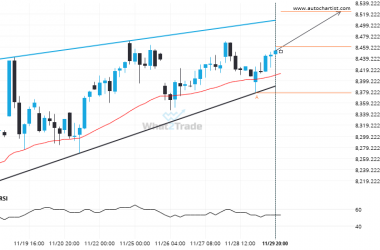
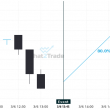
ASX 200 formed a Rising Wedge on the 4 hour chart. Retest of resistance in sight.
ASX 200 is heading towards the resistance line of a Rising Wedge and could reach this point within…
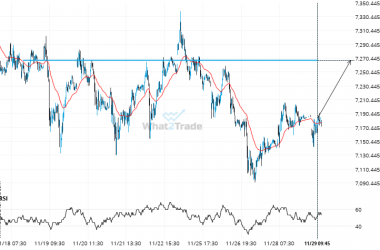
Supports and resistances are primary concepts of technical analysis. CAC 40 is heading for an important price of 7267.1001 – read about what this could mean for the future.
CAC 40 is moving towards a key resistance level at 7267.1001. CAC 40 has previously tested this level…

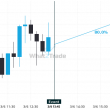
Nikkei 225 is quickly approaching the resistance line of a Inverse Head and Shoulders. We expect either a breakout through this line or a rebound.
Nikkei 225 was identified at around 38232.0 having recently rebounded of the support on the 1 hour data…
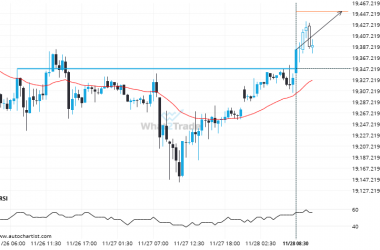
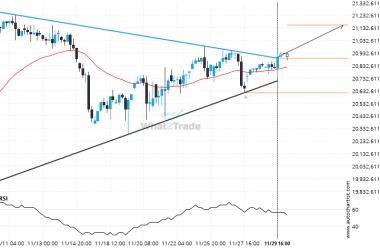
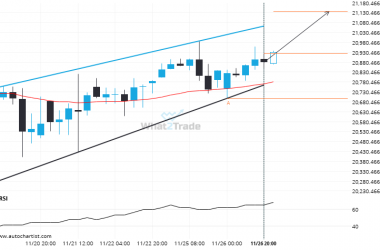
DAX 40 may be on a start of a new bullish trend after its breakout through this important resistance level
The breakout of DAX 40 through the 19348.0000 price line is a breach of an important psychological price…
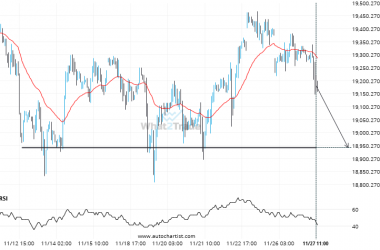
After testing the resistance line numerous times, Nikkei 225 is once again approaching this line. Can we expect a bullish trend to follow?
Nikkei 225 is heading towards the resistance line of a Channel Down. If this movement continues, the price…
DAX 40 is approaching 18942.0996. We expect either a breakout through this line, or a rebound.
The movement of DAX 40 towards 18942.0996 price line is yet another test of the line it reached…
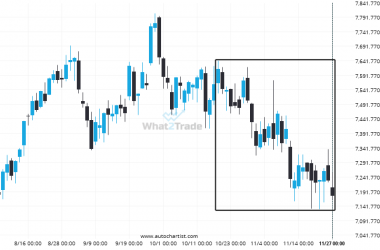
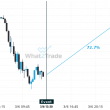
An unexpected large move has occurred on CAC 40 Daily chart! Is this a sign of something new? What can we expect?
CAC 40 experienced an extremely large move that lasted 41. This movement is in the 5.0 percentile and…
Important resistance line being approached by NAS 100. This price has been tested numerous time in the last 8 days
NAS 100 is heading towards the resistance line of a Rising Wedge. If this movement continues, the price…