
Browsing Category
Global Indices
6962 posts
Will FTSE 100 break through the support level it tested before?
FTSE 100 is moving towards a line of 8552.5000 which it has tested numerous times in the past.…
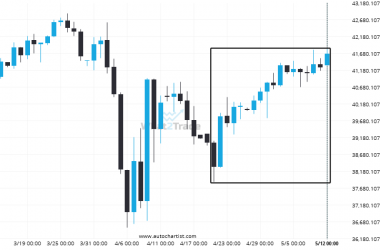
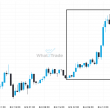
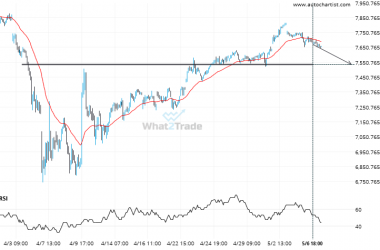
DOW 30 – It’s perhaps in these huge moves where the greatest opportunity lies
DOW 30 hits 41652.47 after a 8.74% move spanning 22 days.
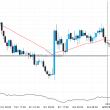
DAX 40 is signaling a possible trend reversal on the intraday charts with price not breaching support.
DAX 40 is approaching the resistance line of a Rising Wedge. It has touched this line numerous times…
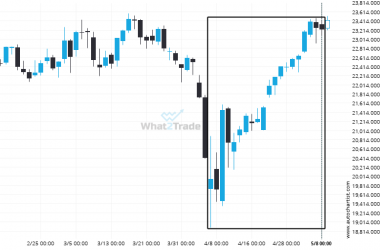
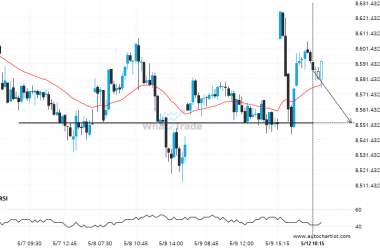
An unexpected large move has occurred on DAX 40 Daily chart! Is this a sign of something new? What can we expect?
An unexpected large move has occurred on DAX 40 Daily chart beginning at 19951.4 and ending at 23224.1.…
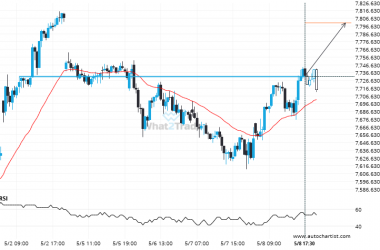
CAC 40 – breach of price line that’s been previously tested numerous times before
The price of CAC 40 in heading in the direction of 7800.3799. Despite the recent breakout through 7731.6001…
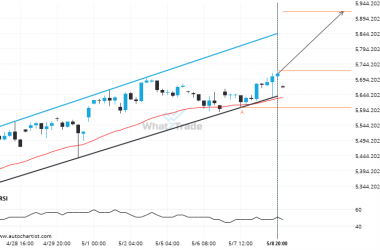
US 500 is approaching a resistance line of a Channel Up. It has touched this line numerous times in the last 11 days.
US 500 is moving towards a resistance line. Because we have seen it retrace from this line before,…
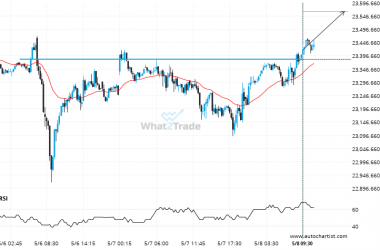
It’s time to make a decision on DAX 40 – its recent breach of 23384.3008 could be a sign of a new trend to follow.
DAX 40 has broken through a resistance line. It has touched this line numerous times in the last…
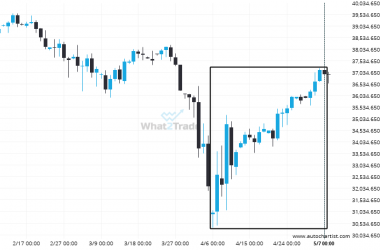
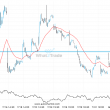
Extreme movement experienced on Nikkei 225. Check this chart to see what to do next
Nikkei 225 has moved higher by 19.23% from 30985.0 to 36943.0 in the last 32 days.
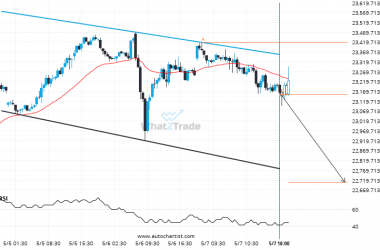
DAX 40 is quickly approaching the support line of a Channel Down. We expect either a breakout through this line or a rebound.
Emerging Channel Down pattern in its final wave was identified on the DAX 40 30 Minutes chart. After…
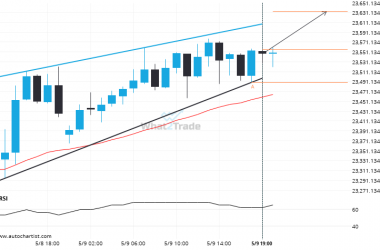
CAC 40 is approaching 7536.0000. We expect either a breakout through this line, or a rebound.
The price of CAC 40 in heading back to the support area. It is possible that it will…