Browsing Category
Global Indices
6961 posts
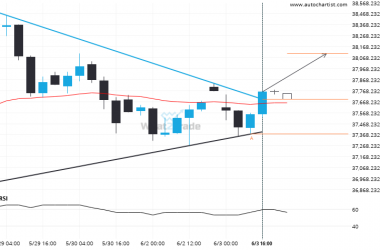
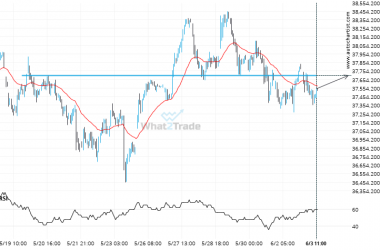
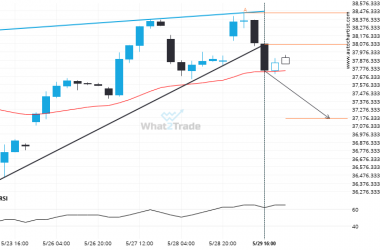
Nikkei 225 through 37689.35294117647. Is this a confirming a breakout? Will it continue its path in the current trend toward 38106.6602?
Nikkei 225 has broken through a resistance line of a Triangle chart pattern. If this breakout holds true,…
Supports and resistances are primary concepts of technical analysis. Nikkei 225 is heading for an important price of 37699.0000 – read about what this could mean for the future.
Nikkei 225 is moving towards a key resistance level at 37699.0000. This is a previously tested level for…
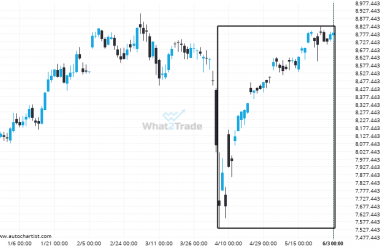
An unexpected large move has occurred on FTSE 100 Daily chart! Is this a sign of something new? What can we expect?
For those of you that don’t believe in trends, this may be an opportunity to take advantage of…
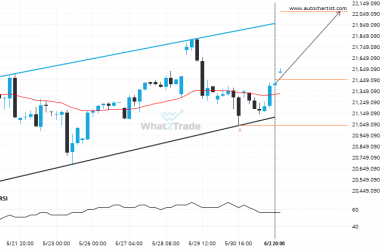
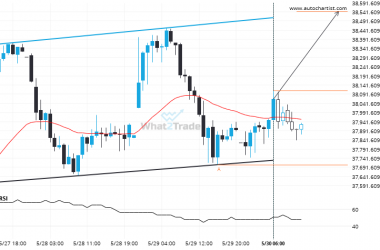
NAS 100 formed a Channel Up on the 4 hour chart. Retest of resistance in sight.
An emerging Channel Up has been detected on NAS 100 on the 4 hour chart. There is a…
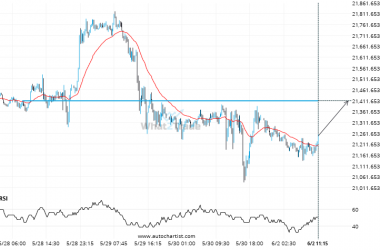
After testing 21409.7012 numerous times, NAS 100 is once again approaching this price point. Can we expect a bullish trend to follow?
NAS 100 is moving towards a line of 21409.7012 which it has tested numerous times in the past.…
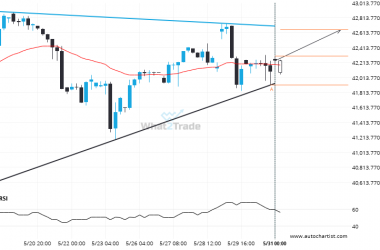
DOW 30 is signaling a possible trend reversal on the intraday charts with price not breaching support.
Emerging Triangle detected on DOW 30 – the pattern is an emerging one and has not yet broken…
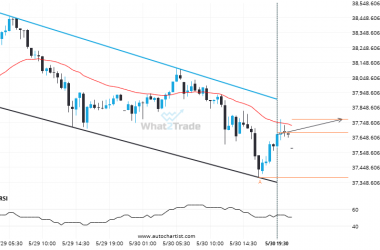
Nikkei 225 is quickly approaching the resistance line of a Channel Down. We expect either a breakout through this line or a rebound.
Nikkei 225 was identified at around 37683.0 having recently rebounded of the support on the 30 Minutes data…
A possible move on Nikkei 225 as it heads towards resistance
Nikkei 225 is moving towards a resistance line. Because we have seen it retrace from this line before,…
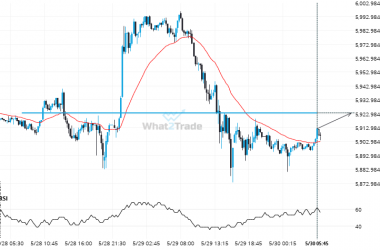
US 500 keeps moving closer towards 5923.4502. Will it finally breach this level?
US 500 is moving towards a line of 5923.4502 which it has tested numerous times in the past.…
Nikkei 225 broke through a support at 2025-05-29T14:00:00.000Z, with the price momentum continuing to move in an downward direction over the next hours, good opportunity presents itself with the price expected to reach 37165.6666.
You would be well advised to confirm the breakout that has just occurred – do you believe the…

