
Browsing Category
Global Indices
6959 posts
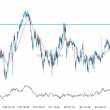
Nikkei 225 through 38461.53846153846. Is this a confirming a breakout? Will it continue its path in the current trend toward 38204.2397?
Nikkei 225 has broken through the support line which it has tested twice in the past. We have…
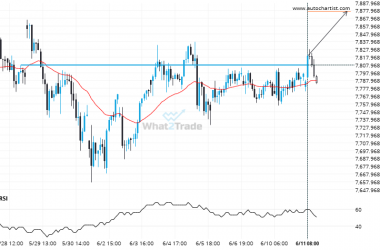
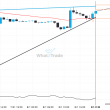
After testing 7807.6001 numerous times, CAC 40 has finally broken through. Can we expect a bullish trend to follow?
CAC 40 is once again retesting a key horizontal resistance level at 7807.6001. It has tested this level…
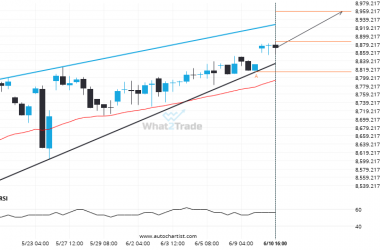
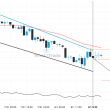
A Rising Wedge has formed, FTSE 100 is approaching support. Can we expect a breakout and the start of a new trend or a reversal?
FTSE 100 is heading towards the resistance line of a Rising Wedge and could reach this point within…
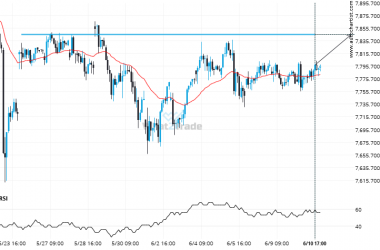
CAC 40 seems to be on its way to resistance – a possible opportunity?
CAC 40 is heading towards a line of 7845.1001. If this movement continues, the price of CAC 40…

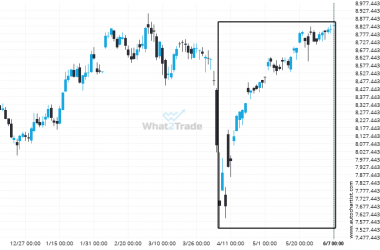
FTSE 100 moves higher to 8830.28 in the last 65 days.
FTSE 100 hits 8830.28 after a 15.02% move spanning 65 days.
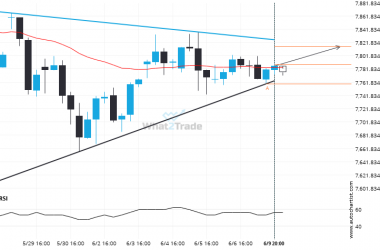
Because CAC 40 formed a Triangle pattern, we expect it to touch the resistance line. If it breaks through resistance it may move much higher
CAC 40 is approaching the resistance line of a Triangle. It has touched this line numerous times in…
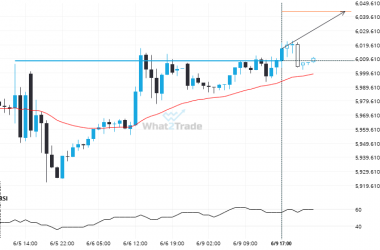
Breach of 6008.0898 could mean a start of a bullish trend on US 500
US 500 has broken through 6008.0898 which it has tested numerous times in the past. We have seen…
Is the extremely large movement on FTSE 100 a sign of things to come?
Those of you that are trend followers are probably eagerly watching FTSE 100 to see if its latest…
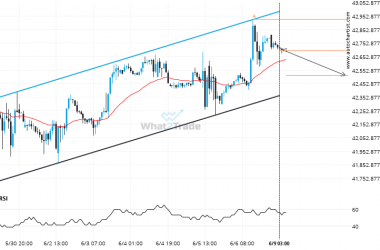
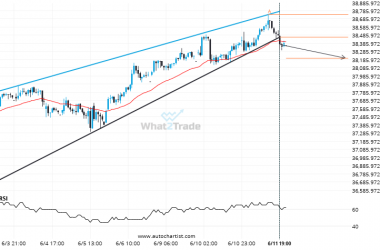
DOW 30 – approaching a support line that has been previously tested at least twice in the past
A Channel Up pattern was identified on DOW 30 at 42696.4, creating an expectation that it may move…
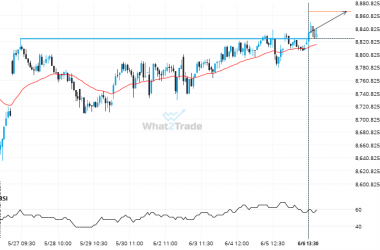
Important price line breached by FTSE 100. This price has been tested numerous times before.
FTSE 100 is once again retesting a key horizontal resistance level at 8825.0703. It has tested this level…