
Browsing Category
Futures
10896 posts
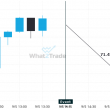
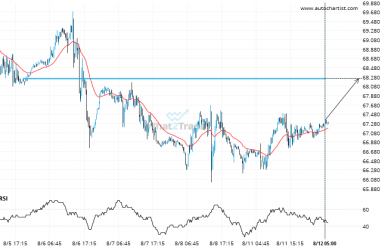
Big movement possible on Brent Crude after a breach of 66.2790
Brent Crude has broken through a support line. It has touched this line numerous times in the last…
Because Natural Gas formed a Channel Down pattern, we expect it to touch the resistance line. If it breaks through resistance it may move much higher
A Channel Down pattern was identified on Natural Gas at 2.7805, creating an expectation that it may move…
A possible move on Silver Spot as it heads towards support
Silver Spot is approaching the support line of a Channel Up. It has touched this line numerous times…
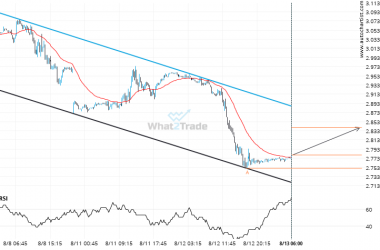
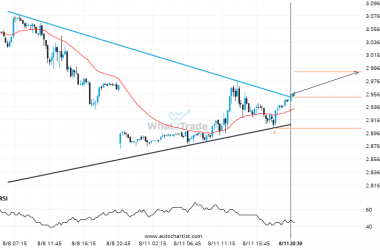
A possible move by Natural Gas towards 2.8829
Natural Gas has broken through the support line of a Pennant technical chart pattern. Because we have seen…
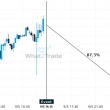
Brent Crude keeps moving closer towards 68.2385. Will it finally breach this level?
The movement of Brent Crude towards 68.2385 price line is yet another test of the line it reached…
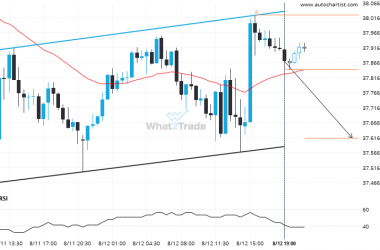
Natural Gas through 2.9504473684210524. Is this a confirming a breakout? Will it continue its path in the current trend toward 2.9896?
The breakout of Natural Gas through the resistance line of a Triangle could be a sign of the…
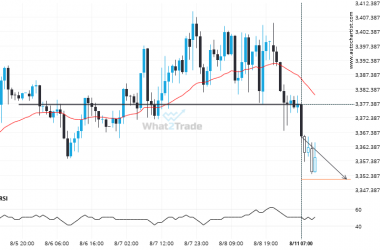
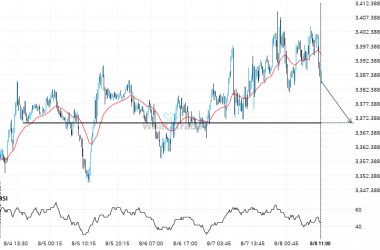
If you’re long Gold Spot you should be aware that 3377.0901 has just been breached – a level tested 3 time in the past
Gold Spot has broken through a line of 3377.0901. If this breakout holds true, we could see the…
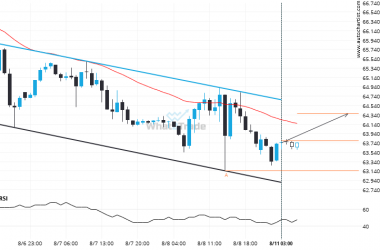
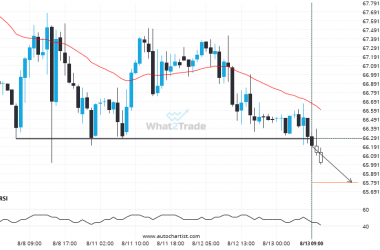
US Oil is signaling a possible trend reversal on the intraday charts with price not breaching support.
US Oil was identified at around 63.7855 having recently rebounded of the support on the 1 hour data…
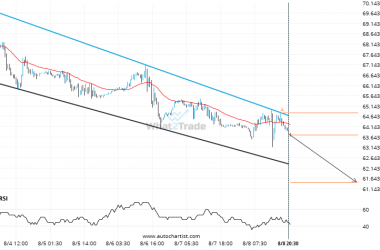
US Oil – approaching a support line that has been previously tested at least twice in the past
US Oil was identified at around 63.741 having recently rebounded of the resistance on the 30 Minutes data…
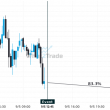
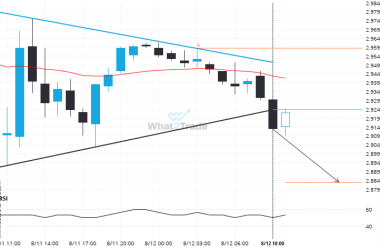
Will Gold Spot break through the support level it tested before?
The movement of Gold Spot towards 3370.6250 price line is yet another test of the line it reached…