
Browsing Category
Futures
10823 posts
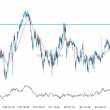
Silver Spot – approaching a price line that has been previously tested numerous times in the past
Silver Spot is moving towards a key support level at 36.0185. This is a previously tested level for…
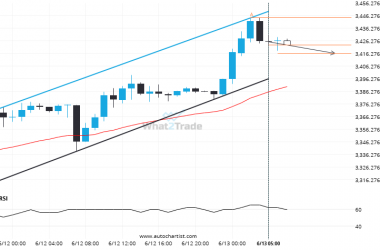
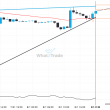
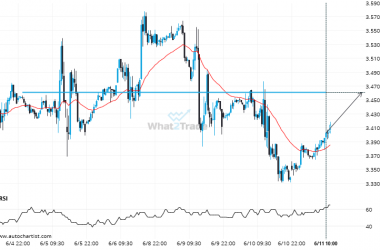
Gold Spot – approaching a support line that has been previously tested at least twice in the past
An emerging Channel Up has been detected on Gold Spot on the 1 hour chart. There is a…
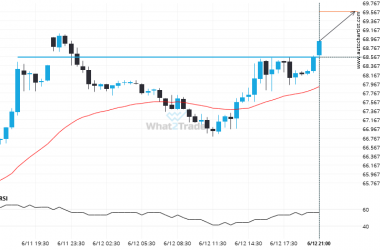
US Oil is currently testing a level of 68.5650. Will the breakout continue or will things reverse?
US Oil has broken through a line of 68.5650. If this breakout holds true, we could see the…
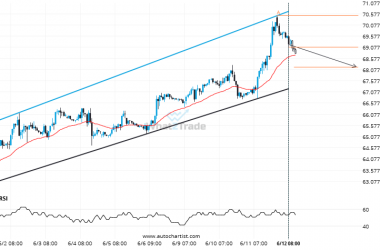
Brent Crude is signaling a possible trend reversal on the intraday charts with price not breaching resistance.
Emerging Channel Up pattern in its final wave was identified on the Brent Crude 1 hour chart. After…
If you’re short Natural Gas you should be aware of the rapidly approaching level of 3.4655
Natural Gas is en route to a very important line that will be a definite deciding factor of…
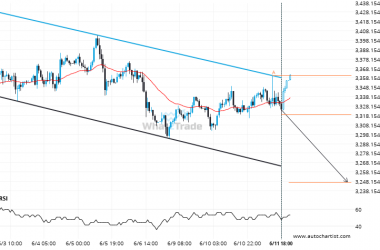
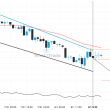
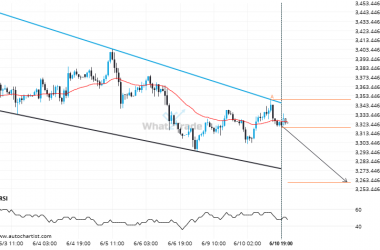
After testing the support line numerous times, Gold Spot is once again approaching this line. Can we expect a bearish trend to follow?
Gold Spot is heading towards the support line of a Channel Down. If this movement continues, the price…
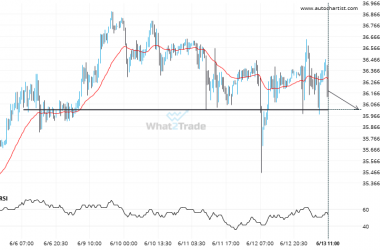
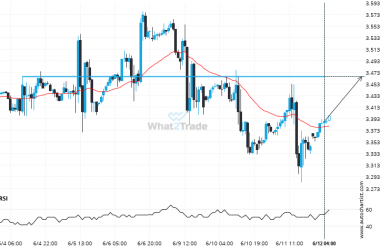
Natural Gas seems to be on its way to resistance – a possible opportunity?
A strong resistance level has been identified at 3.4615 on the 30 Minutes Natural Gas chart. Natural Gas…
Important resistance line being approached by Natural Gas. This price has been tested numerous time in the last 5 days
A Channel Down pattern was identified on Natural Gas at 3.3885, creating an expectation that it may move…
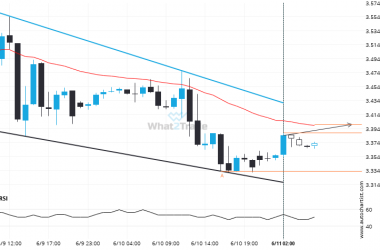
Gold Spot is approaching a support line of a Falling Wedge. It has touched this line numerous times in the last 8 days.
Gold Spot is trapped in a Falling Wedge formation, implying that a breakout is Imminent. This is a…

After testing the resistance line numerous times, Brent Crude is once again approaching this line. Can we expect a bullish trend to follow?
Brent Crude is heading towards the resistance line of a Rising Wedge and could reach this point within…