
Browsing Category
Forex
6898 posts
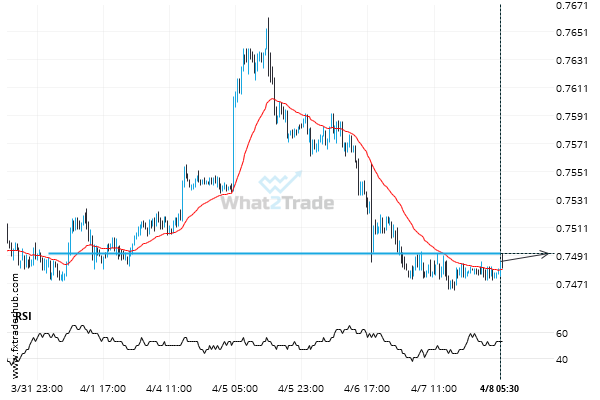
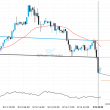
Breach of important price line imminent by AUD/USD
AUD/USD is moving towards a line of 0.7493 which it has tested numerous times in the past. We…
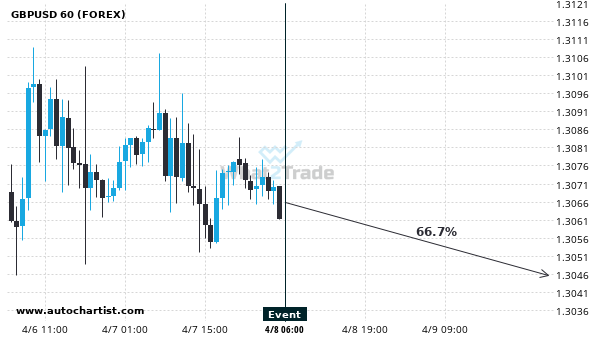
We expect GBPUSD to trend downwards right now.
Based on the last 12 Consumer Confidence events in Japan, we expect GBPUSD to trend downwards right now.…
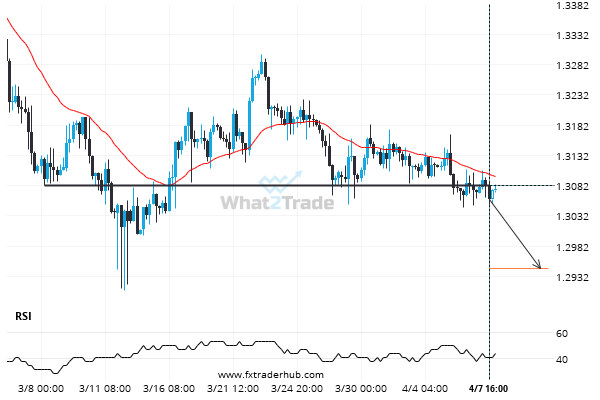
Should we expect a bearish trend on GBP/USD?
The breakout of GBP/USD through the 1.3082 price line is a breach of an important psychological price that…
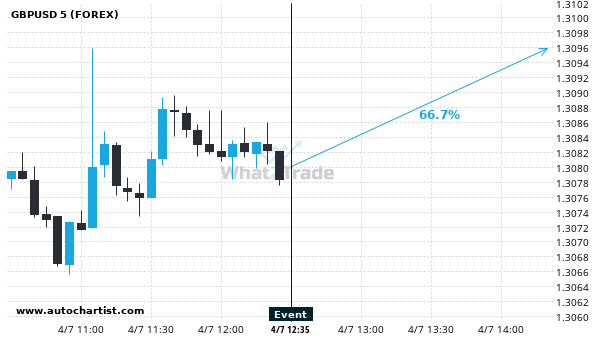
We expect GBPUSD to trend upwards today with a 66.67% chance.
Based on the last 12 Continuing Jobless Claims events in United States, we expect GBPUSD to trend upwards…
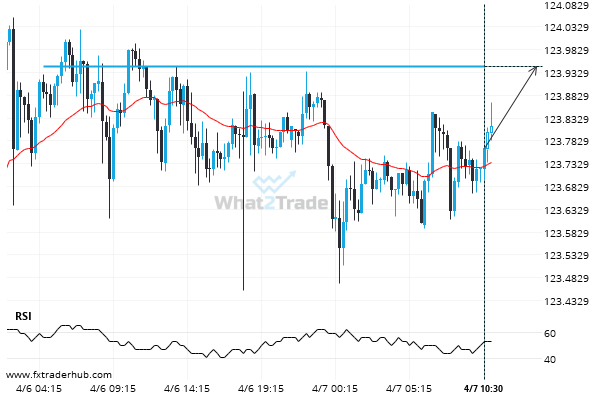
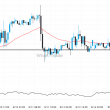
USD/JPY – getting close to psychological price line
USD/JPY is moving towards a resistance line. Because we have seen it retrace from this level in the…
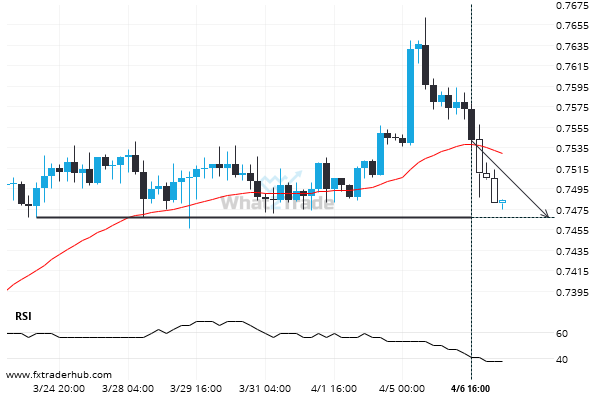
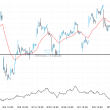
Breach of important price line imminent by AUD/USD
AUD/USD is moving towards a line of 0.7466 which it has tested numerous times in the past. We…
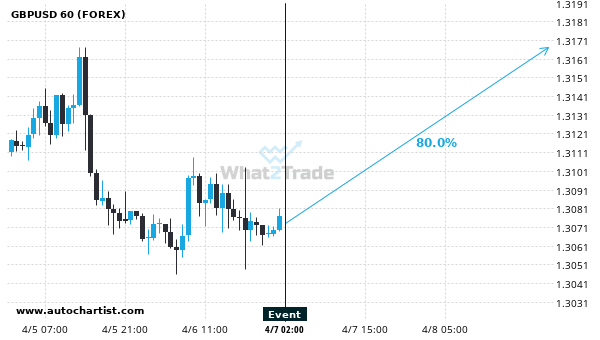
We expect GBPUSD to trend upwards today with a 80% chance.
Based on the last 12 Balance of Trade events in Australia, we expect GBPUSD to trend upwards later…
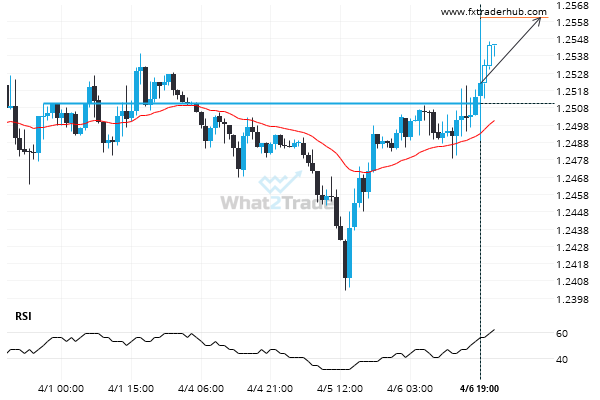
Should we expect a bullish trend on USD/CAD?
The breakout of USD/CAD through the 1.2511 price line is a breach of an important psychological price that…
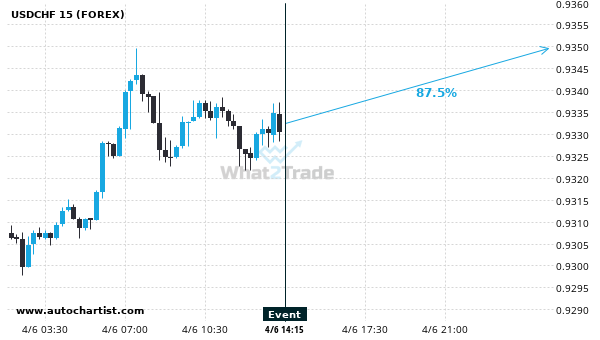
We expect a $225.042 movement on USDCHF within the next 12 hours.
Based on the last 12 Ivey PMI s.a events in Canada, we expect a $225.042 movement on USDCHF…
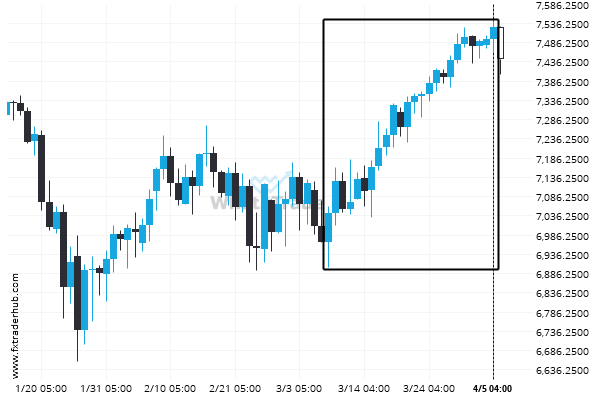
AUS200 experienced an exceptionally large movement
For those of you that don’t believe in trends, this may be an opportunity to take advantage of…