
Browsing Category
Forex
6901 posts
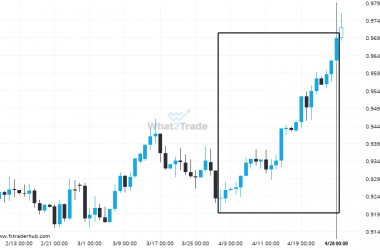
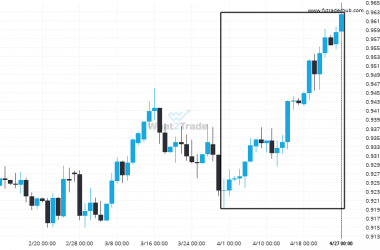
Huge bullish move on USD/CHF
USD/CHF has moved higher by 4.94% from 0.923 to 0.969 in the last 29 days.
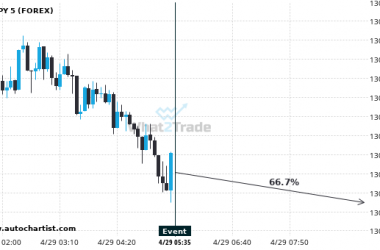
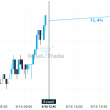
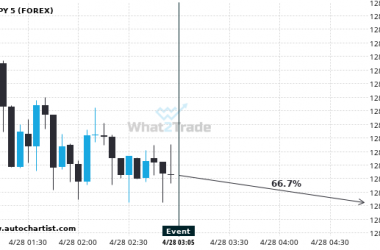
A possible $76.7 movement on USDJPY within the next 4 hours.
Based on the last 12 GDP Growth Rate QoQ 1st Est events in France, we could see a…
What’s going on with GBP/USD?
Those of you that are trend followers are probably eagerly watching GBP/USD to see if its latest 4.06%…
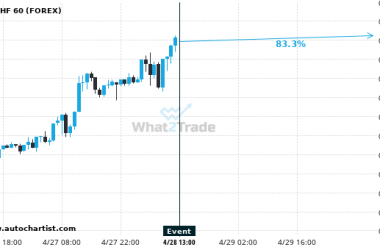
USDCHF – a possible trend upwards with a 83.33% chance.
Based on the last 12 Continuing Jobless Claims events in United States, USDCHF could experience an upwards trend.…
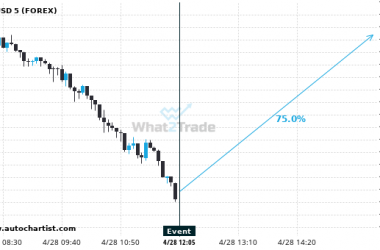
We may see a $400 movement on GBPUSD within the next 4 hours.
Based on the last 12 Inflation Rate YoY Prel events in Germany, we could see a $400 movement…
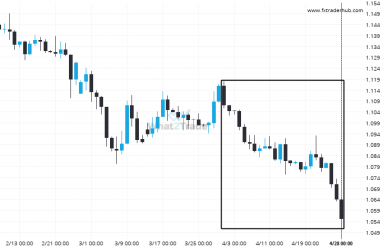
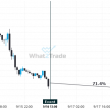
Huge bearish move on EUR/USD
EUR/USD has moved lower by 4.68% from 1.116 to 1.055 in the last 29 days.
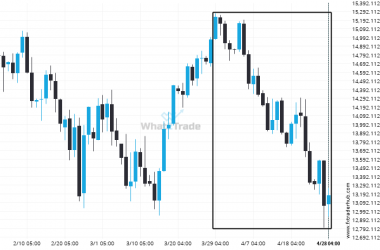
What’s going on with NAS100?
Those of you that are trend followers are probably eagerly watching NAS100 to see if its latest 13.47%…
Maybe a $93.24 movement on USDJPY within the next 2 hours.
We could see a $93.24 movement on USDJPY within the next 2 hours. USDJPY could trend downwards 2…
Huge bullish move on USD/CHF
USD/CHF has moved higher by 4.24% from 0.923 to 0.962 in the last 28 days.
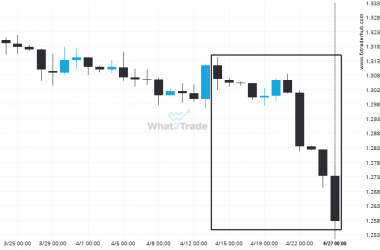
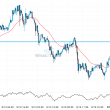
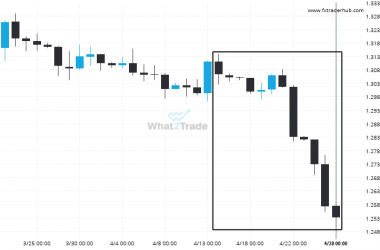
Huge bearish move on GBP/USD
GBP/USD has moved lower by 3.74% from 1.312 to 1.258 in the last 14 days.