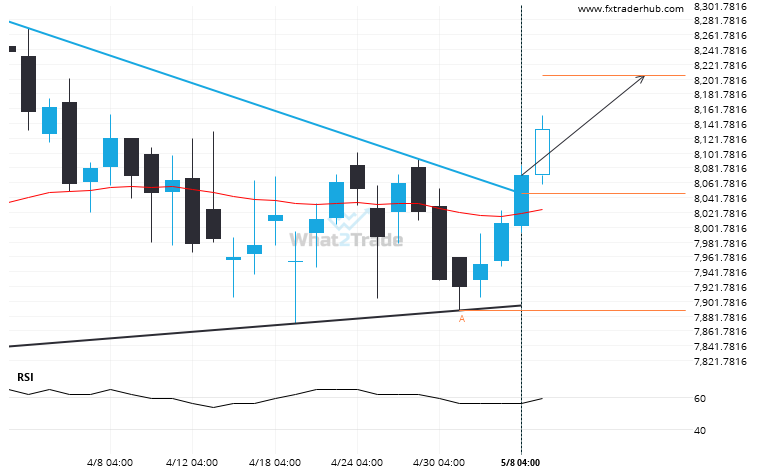
Triangle pattern identified on FRA40 has broken through a resistance level with the price momentum continuing to move in an upward direction. A solid trading opportunity continues with the price expected to reach 8206.1736 in the next 7.
Related Posts
Rare bullish streak on the ASX 200 Daily chart.
ASX 200 posted a high rate of consecutive bullish candles on the Daily chart.
After testing 7892.2002 numerous times, CAC 40 has finally broken through. Can we expect a bullish trend to follow?
CAC 40 has broken through 7892.2002 which it has tested numerous times in the past. We have seen…
US 500 through 6451.963030303029. Is this a confirming a breakout? Will it continue its path in the current trend toward 6406.5663?
This trade setup on US 500 is formed by a period of consolidation; a period in which the…