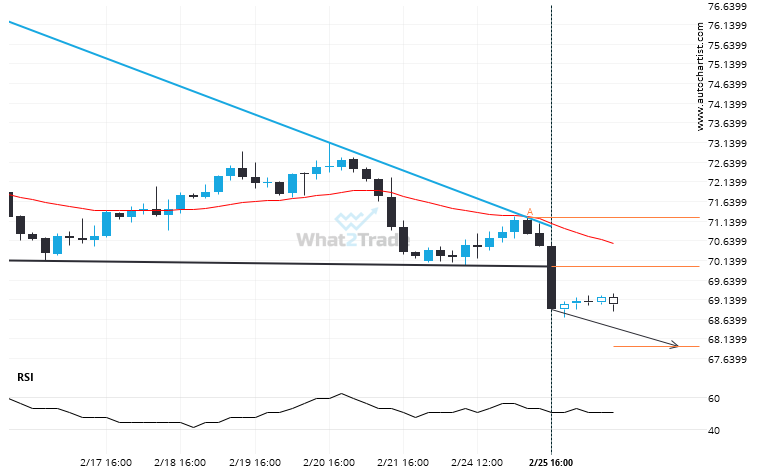
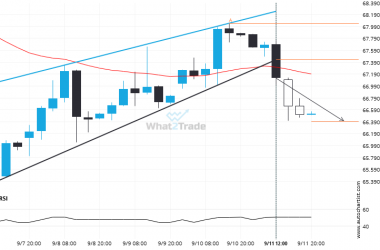
US Oil has broken through a support line of a Descending Triangle and suggests a possible movement to 67.9422 within the next 2 days. It has tested this line in the past, so one should probably wait for a confirmation of this breakout before taking action. If the breakout doesn’t confirm, we could see a retracement back to lines seen in the last 12 days.
Related Posts
Natural Gas formed a Falling Wedge on the 4 hour chart. Retest of support in sight.
An emerging Falling Wedge has been detected on Natural Gas on the 4 hour chart. There is a…
US Oil may be on a start of a new bearish trend after its breakout through this important support level
US Oil has broken through a line of 62.6985 and suggests a possible movement to 62.2475 within the…
Important support line being approached by Gold Spot. This price has been tested numerous time in the last 6 days
The movement of Gold Spot towards the support line of a Descending Triangle is yet another test of…