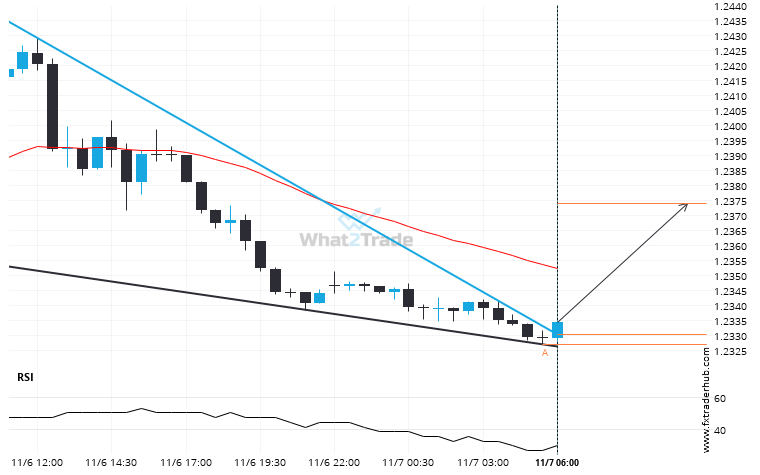
GBP/USD moved through the resistance line of a Falling Wedge at 1.2330022580645161 on the 30 Minutes chart. This line has been tested a number of times in the past and this breakout could mean an upcoming change from the current trend. It may continue in its current direction toward 1.2374.
Related Posts
EURUSD is quickly approaching the support line of a Triangle. We expect either a breakout through this line or a rebound.
EURUSD is moving towards a support line. Because we have seen it retrace from this line before, we…
EURJPY – approaching a price line that has been previously tested numerous times in the past
EURJPY is approaching a resistance line at 173.1135. If it hits the resistance line, it may break through…
A possible move on GBPCHF as it heads towards resistance
GBPCHF is heading towards the resistance line of a Channel Up and could reach this point within the…