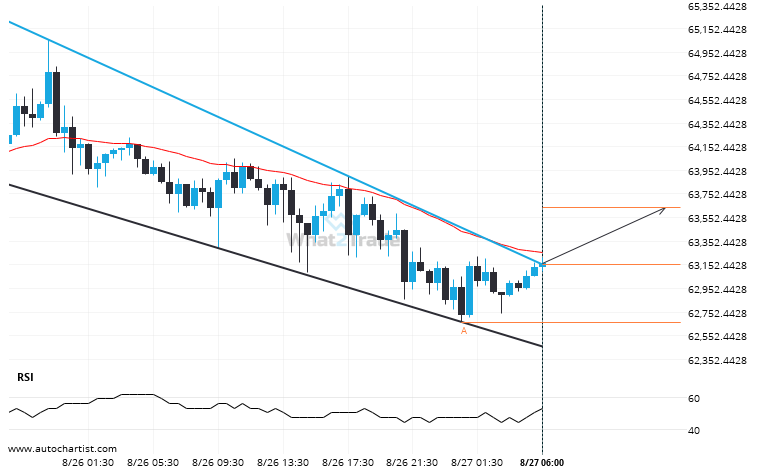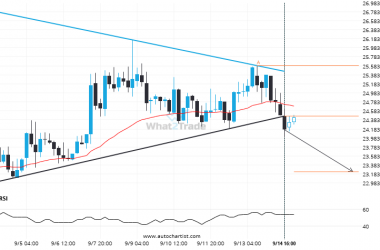
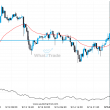
BTCUSD moved through the resistance line of a Channel Down at 63155.278648648644 on the 30 Minutes chart. This line has been tested a number of times in the past and this breakout could mean an upcoming change from the current trend. It may continue in its current direction toward 63642.2559.
BTCUSD through 63155.278648648644. Is this a confirming a breakout? Will it continue its path in the current trend toward 63642.2559?