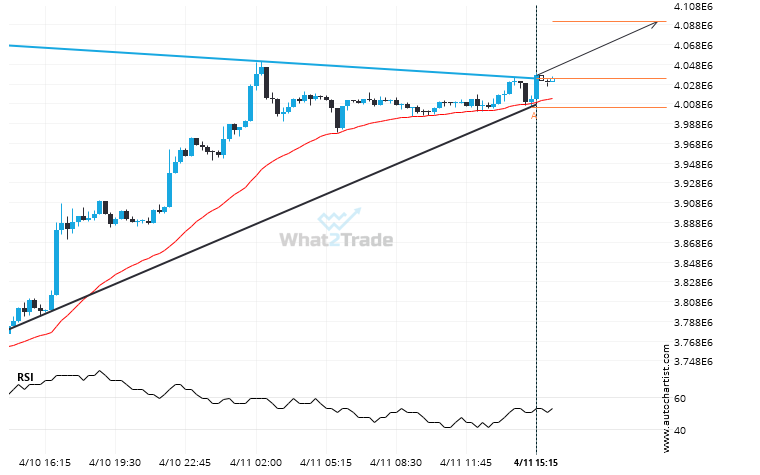
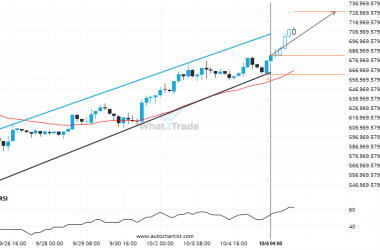
BTCJPY has broken through the resistance line of a Triangle technical chart pattern. Because we have seen it retrace from this line in the past, one should wait for confirmation of the breakout before taking any action. It has touched this line twice in the last 2 days and suggests a possible target level to be around 4091489.6338 within the next 6 hours.
Related Posts
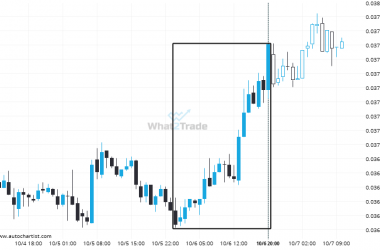
A very large move was recorded on ETHBTC. The size of the shift is exceptional.
ETHBTC has moved higher by 3.48% from 0.03646 to 0.03773 in the last 20 hours.
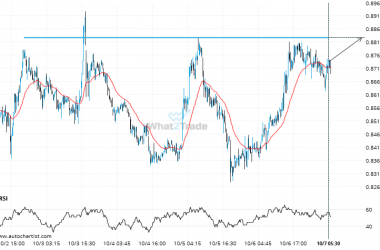
If you’re short ADAUSD you should be aware of the rapidly approaching level of 0.8828
ADAUSD is moving towards a line of 0.8828 which it has tested numerous times in the past. We…
Because ETHJPY formed a Channel Up pattern, we expect it to touch the resistance line. If it breaks through resistance it may move much higher
ETHJPY is approaching the resistance line of a Channel Up. It has touched this line numerous times in…

