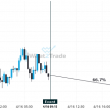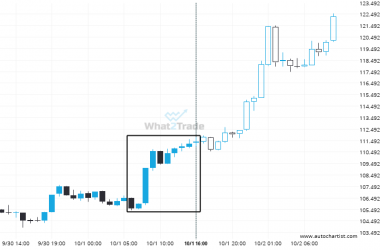
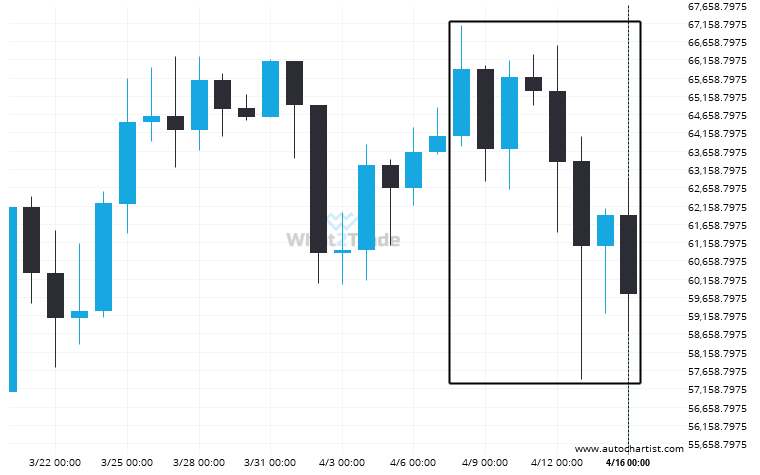
An unexpected large move has occurred on BTCEUR Daily chart beginning at 65889.02 and ending at 59741.99. Is this a sign of something new? What can we expect in the future?
BTCEUR hits 59741.99 after a 9.33% move spanning 9 days

An unexpected large move has occurred on BTCEUR Daily chart beginning at 65889.02 and ending at 59741.99. Is this a sign of something new? What can we expect in the future?