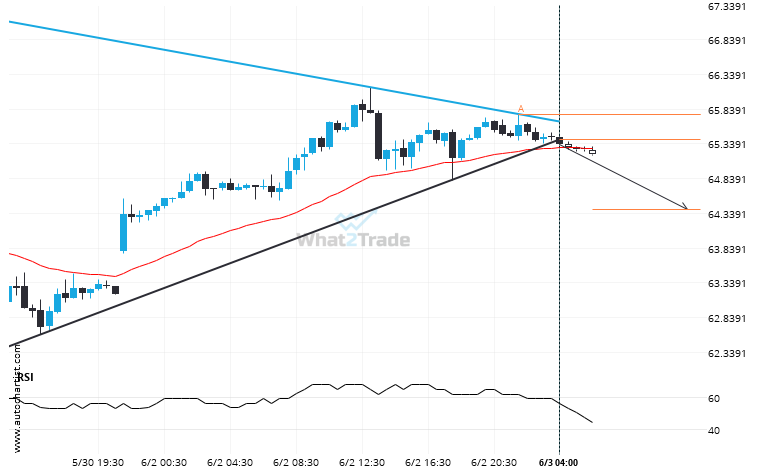
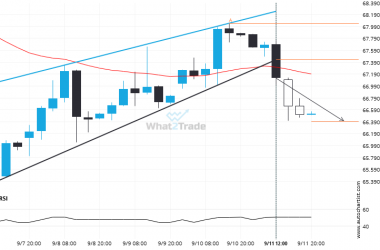
Brent Crude has broken through a support line of a Triangle chart pattern. If this breakout holds true, we may see the price of Brent Crude testing 64.4026 within the next 8 hours. But don’t be so quick to trade, it has tested this line in the past, so you should confirm the breakout before taking any action.
Brent Crude breakout from a Triangle trade setup. Will it continue this trend to hit the target price?