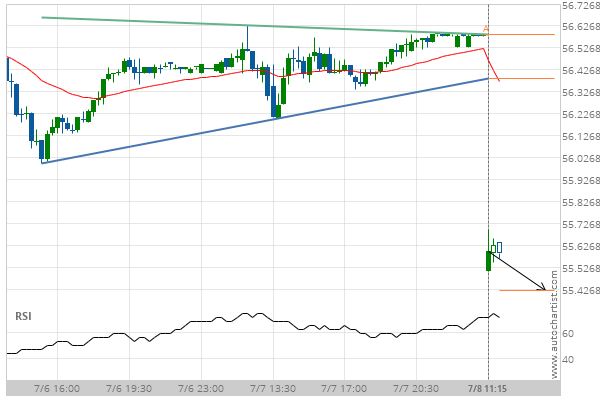
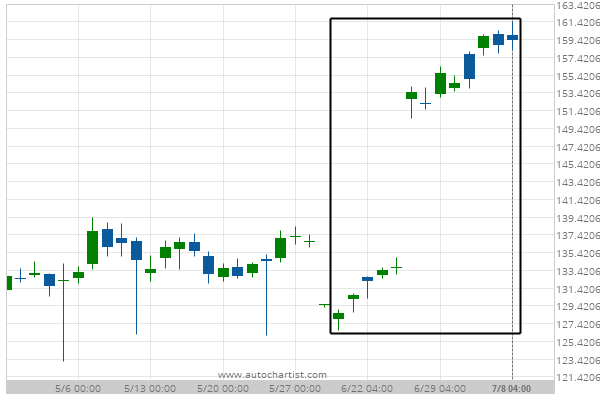
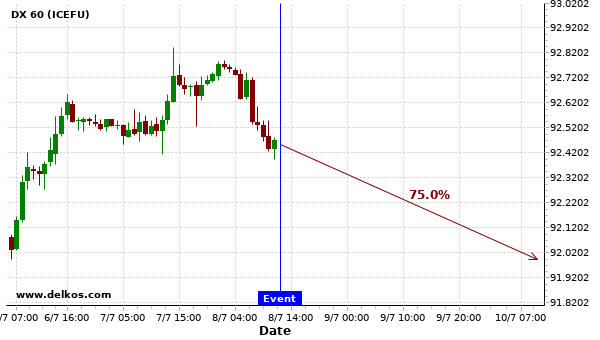
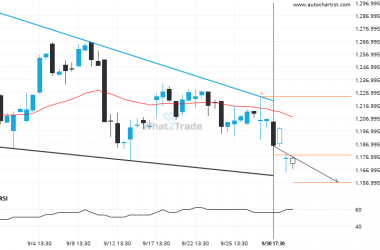
Verizon Communications Inc. has broken through a support line of a Triangle chart pattern. If this breakout holds true, we expect the price of Verizon Communications Inc. to test 55.42 within the next 22 hours. But don’t be so quick to trade, it has tested this line in the past, so you should probably confirm the breakout before placing any trades.
Related Posts
Resistance line breached by BIDU. This price has been tested at least twice before.
BIDU has broken through a resistance line of a Triangle and suggests a possible movement to 141.6768 within…
If you’re long PYPL you should be aware that 66.7950 has just been breached – a level tested 6 time in the past
PYPL has broken through a support line. Because we have seen it retrace from this price in the…
NFLX – approaching a support line that has been previously tested at least twice in the past
A Falling Wedge pattern was identified on NFLX at 1178.335, creating an expectation that it may move to…

