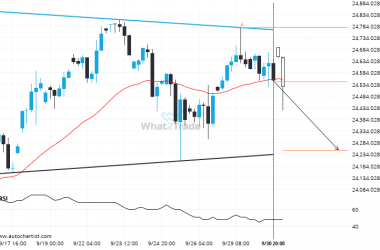
US30 has broken through a support line of a Rectangle chart pattern. If this breakout holds true, we expect the price of US30 to test 28230.5804 within the next 2 days. But don’t be so quick to trade, it has tested this line in the past, so you should probably confirm the breakout before placing any trades.
Related Posts
A possible move on NAS 100 as it heads towards support
NAS 100 is approaching the support line of a Triangle. It has touched this line numerous times in…
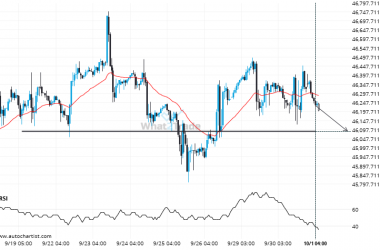
DOW 30 is approaching 46089.0000. We expect either a breakout through this line, or a rebound.
DOW 30 is heading towards a line of 46089.0000. If this movement continues, the price of DOW 30…
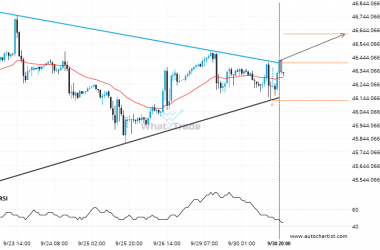
After testing resistance twice in the past, DOW 30 has finally broken through. Can we expect a bullish trend to follow?
DOW 30 has broken through a resistance line of a Triangle and suggests a possible movement to 46612.9534…

