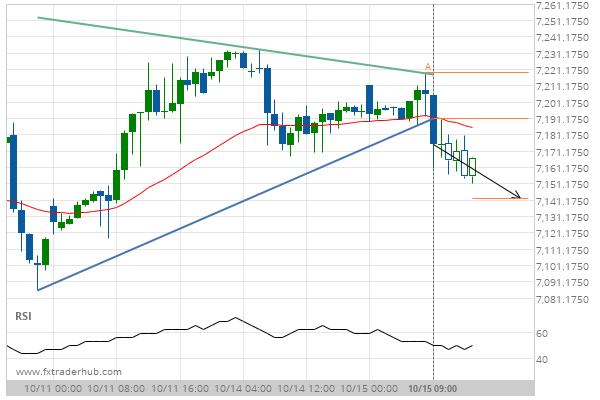
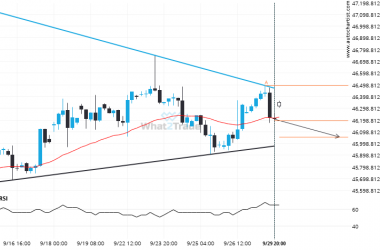
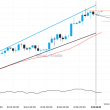
UK100 has broken through a support line of a Triangle chart pattern. If this breakout holds true, we expect the price of UK100 to test 7142.0549 within the next 11 hours. But don’t be so quick to trade, it has tested this line in the past, so you should probably confirm the breakout before placing any trades.
Related Posts
Is the extremely large movement on ASX 200 a sign of things to come?
For those of you that don’t believe in trends, this may be an opportunity to take advantage of…
DOW 30 has broken out from the Falling Wedge pattern. Expect it to hit 43125.5541 soon.
The last 9 4 hour candles on DOW 30 formed a Falling Wedge pattern and broken out through…
Extreme movement experienced on FTSE 100. Check this chart to see what to do next
For those of you that don’t believe in trends, this may be an opportunity to take advantage of…