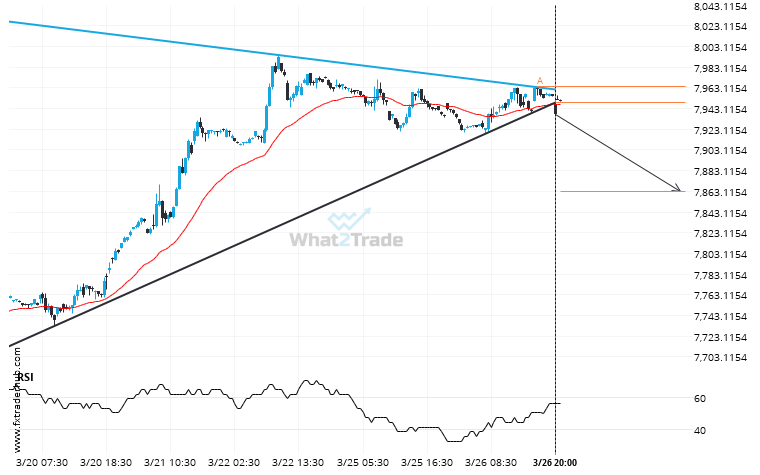
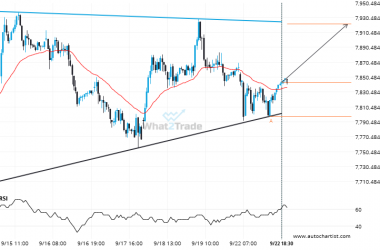
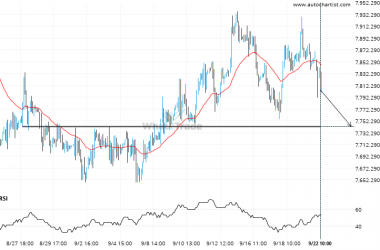
UK100 has broken through a support line of a Triangle chart pattern. If this breakout holds true, we may see the price of UK100 testing 7862.9864 within the next 23 hours. But don’t be so quick to trade, it has tested this line in the past, so you should confirm the breakout before taking any action.
Related Posts
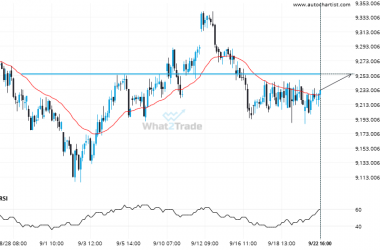
FTSE 100 heading towards a price it has tested 4 times in the recent past.
The movement of FTSE 100 towards 9254.6602 price line is yet another test of the line it reached…
CAC 40 is signaling a possible trend reversal on the intraday charts with price not breaching support.
Emerging Ascending Triangle pattern in its final wave was identified on the CAC 40 30 Minutes chart. After…
If you’re long CAC 40 you should be aware of the rapidly approaching level of 7742.7002
A strong support level has been identified at 7742.7002 on the 1 hour CAC 40 chart. CAC 40…

