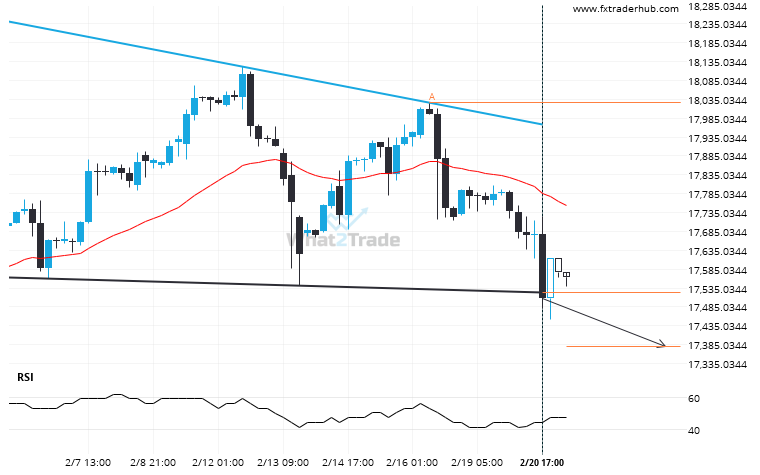
NAS100 moved through the support line of a Descending Triangle at 17523.854838709678 on the 4 hour chart. This line has been tested a number of times in the past and this breakout could mean an upcoming change from the current trend. It may continue in its current direction toward 17379.4852.
Related Posts
Nikkei 225 broke through a support at 2025-05-29T14:00:00.000Z, with the price momentum continuing to move in an downward direction over the next hours, good opportunity presents itself with the price expected to reach 37165.6666.
You would be well advised to confirm the breakout that has just occurred – do you believe the…
DAX 40 – approaching a price line that has been previously tested numerous times in the past
DAX 40 is moving towards a key support level at 23930.6992. DAX 40 has previously tested this level…
A Channel Up has formed, FTSE 100 is approaching support. Can we expect a breakout and the start of a new trend or a reversal?
FTSE 100 was identified at around 8777.07 having recently rebounded of the support on the 4 hour data…