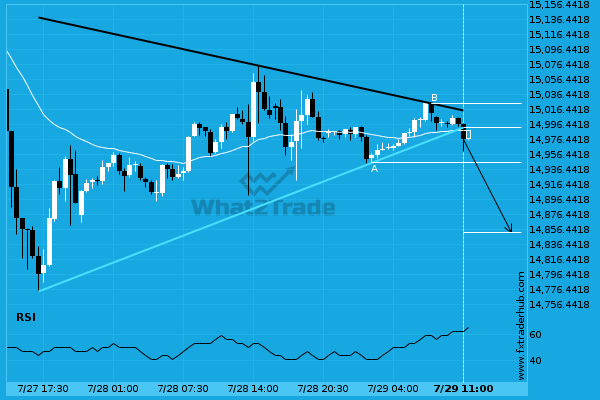
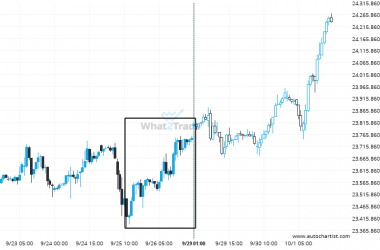
NAS100 has broken through a support line of a Triangle chart pattern. If this breakout holds true, we expect the price of NAS100 to test 14852.5260 within the next 13 hours. But don’t be so quick to trade, it has tested this line in the past, so you should probably confirm the breakout before placing any trades.
Related Posts
After testing 21409.7012 numerous times, NAS 100 is once again approaching this price point. Can we expect a bullish trend to follow?
NAS 100 is moving towards a line of 21409.7012 which it has tested numerous times in the past.…
DOW 30 is signaling a possible trend reversal on the intraday charts with price not breaching support.
Emerging Triangle detected on DOW 30 – the pattern is an emerging one and has not yet broken…
Nikkei 225 is quickly approaching the resistance line of a Channel Down. We expect either a breakout through this line or a rebound.
Nikkei 225 was identified at around 37683.0 having recently rebounded of the support on the 30 Minutes data…