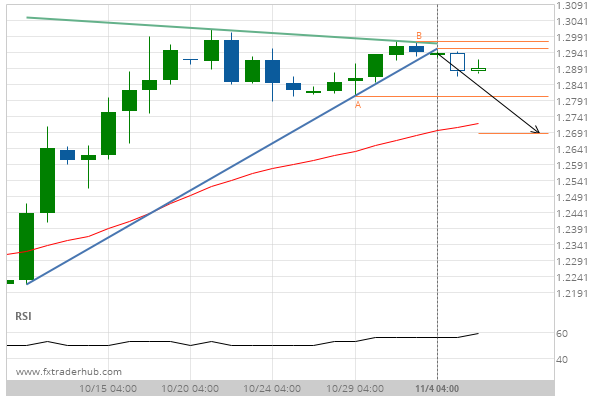
GBP/USD has broken through a support line of a Triangle chart pattern. If this breakout holds true, we expect the price of GBP/USD to test 1.2685 within the next 5 days. But don’t be so quick to trade, it has tested this line in the past, so you should probably confirm the breakout before placing any trades.
Related Posts
GBPJPY has broken through a support line. It has touched this line numerous times in the last 14 days.
GBPJPY has broken through a line of 199.5125 and suggests a possible movement to 198.6128 within the next…
A possible move by EURCHF towards 0.9369
The last 7 4 hour candles on EURCHF formed a Channel Down pattern and broken out through the…
Big movement possible on AUDJPY after a breach of 97.7030
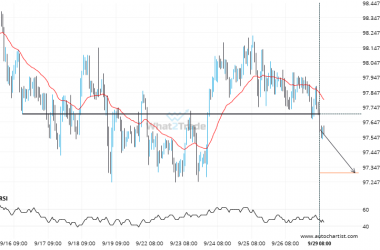
AUDJPY has broken through 97.7030 which it has tested numerous times in the past. We have seen it…

