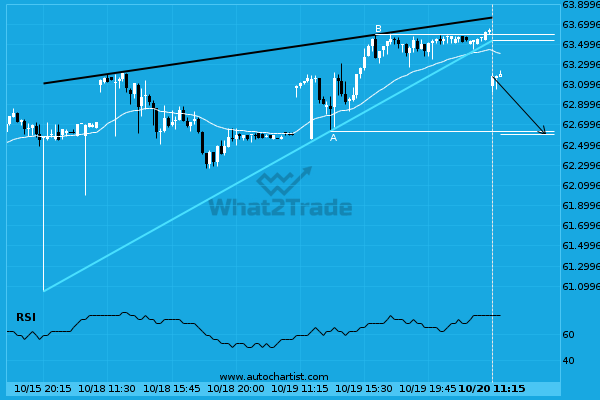
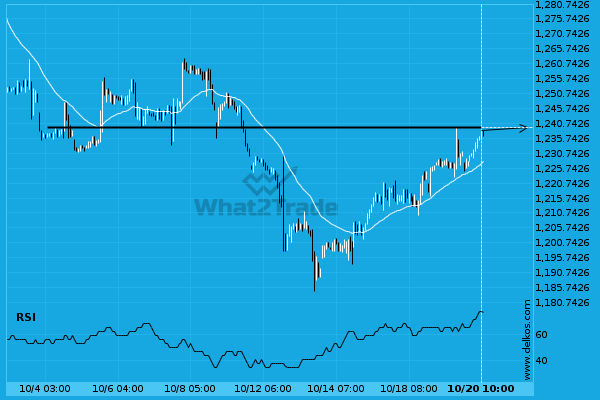
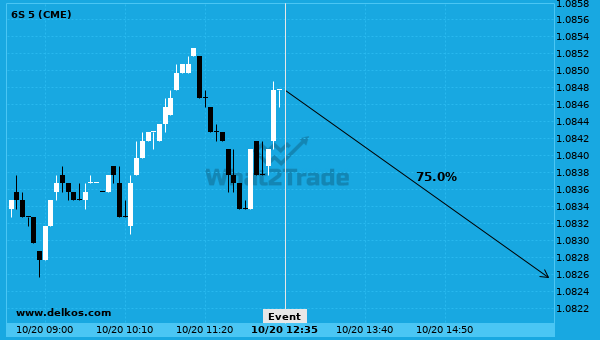
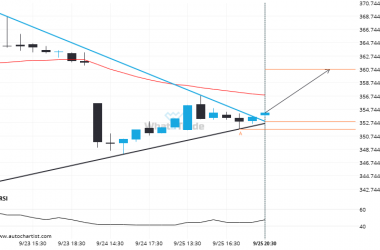
Exxon Mobil Corp. has broken through a support line of a Rising Wedge chart pattern. If this breakout holds true, we may see the price of Exxon Mobil Corp. testing 62.60 within the next 2 days. But don’t be so quick to trade, it has tested this line in the past, so you should confirm the breakout before taking any action.
Related Posts
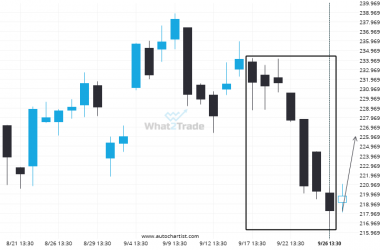
AMZN posted 7 consecutive bearish Daily candles.
AMZN moved lower from 233.7700 to 218.1650 after 7 consecutive daily candles over 10 days.
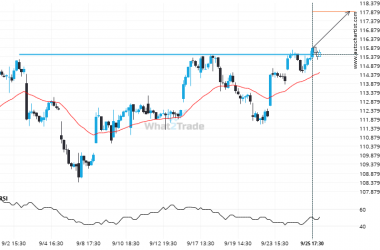
XOM – breach of price line that’s been previously tested numerous times before
XOM has breached the resistance line at 115.4800. It may continue the bullish trend towards 117.9020, or, it…
ADBE has broken through resistance of a Triangle. It has touched this line at least twice in the last 8 days.
This trade setup on ADBE is formed by a period of consolidation; a period in which the price…

