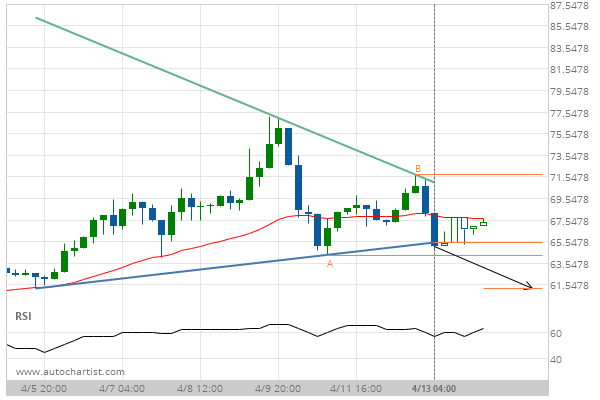
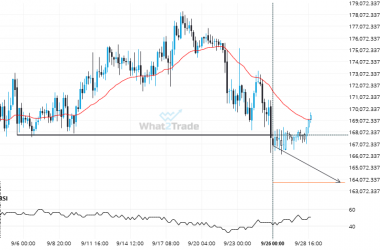
DASHEUR has broken through a support line of a Triangle chart pattern. If this breakout holds true, we expect the price of DASHEUR to test 61.1754 within the next 2 days. But don’t be so quick to trade, it has tested this line in the past, so you should probably confirm the breakout before placing any trades.
Related Posts
ETHJPY formed a Channel Up on the 1 hour chart. Retest of support in sight.
An emerging Channel Up has been detected on ETHJPY on the 1 hour chart. There is a possible…
XRPUSD – Large moves like this tend to draw attention.
XRPUSD reached 2.828 after a 5.23% move spanning 15 hours.
Breach of 167826.2344 could mean a start of a bearish trend on BTCAUD
The breakout of BTCAUD through the 167826.2344 price line is a breach of an important psychological price that…

