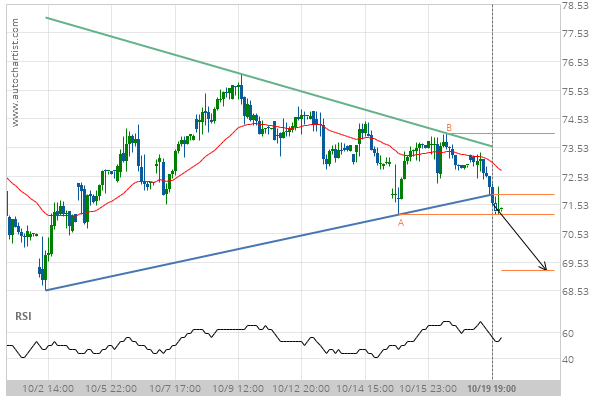
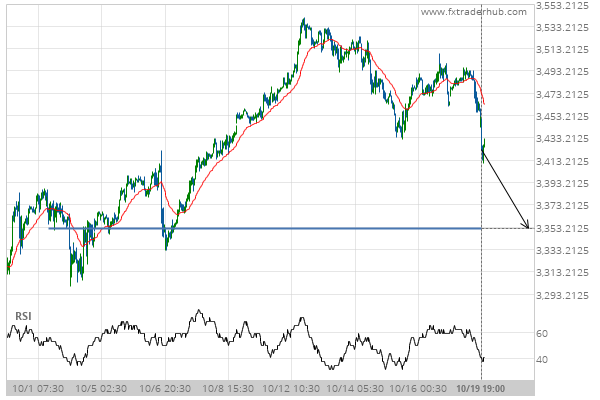
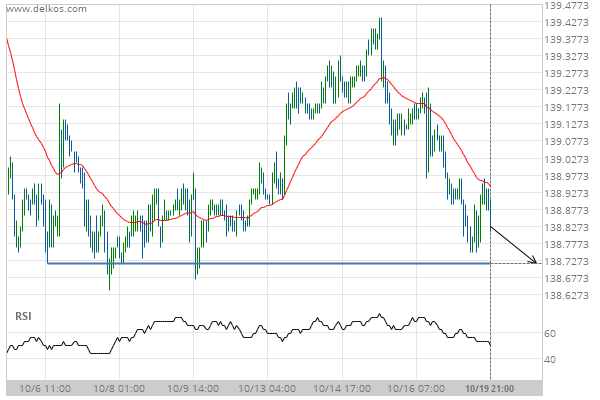
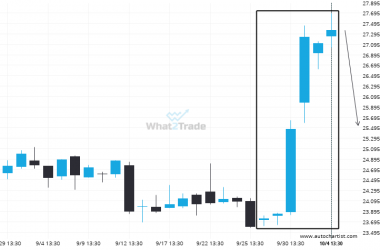
Chevron has broken through a support line of a Triangle chart pattern. If this breakout holds true, we expect the price of Chevron to test 69.24 within the next 2 days. But don’t be so quick to trade, it has tested this line in the past, so you should probably confirm the breakout before placing any trades.
Related Posts
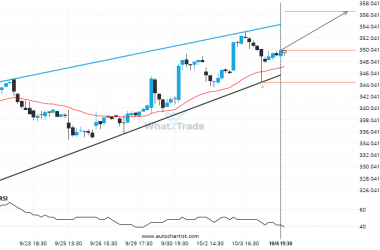
V formed a Rising Wedge on the 1 hour chart. Retest of resistance in sight.
V is heading towards the resistance line of a Rising Wedge and could reach this point within the…
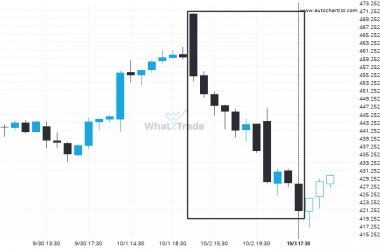
Extreme movement experienced on TSLA. Check the chart to see what to do next.
TSLA recorded a considerable move in the last day — one of its biggest in recent sessions.
PFE has formed 6 bullish candles in a row.
PFE experienced a high number of bullish candles reaching 27.3650 over 9 days.

