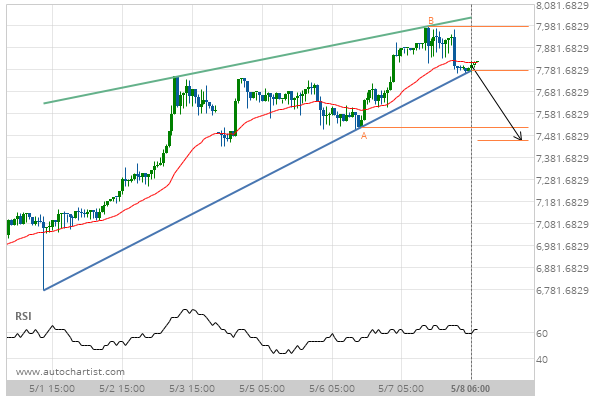
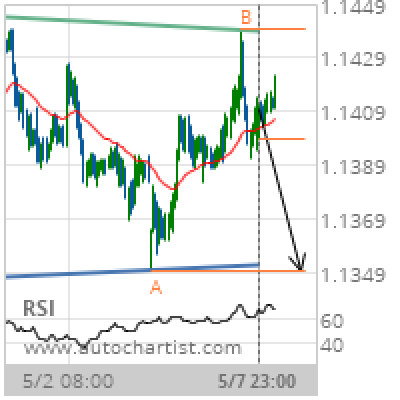
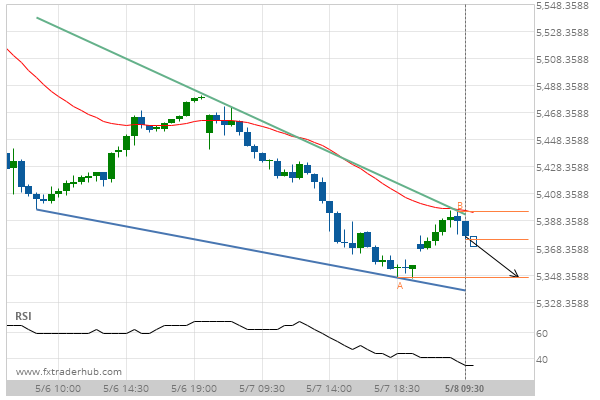
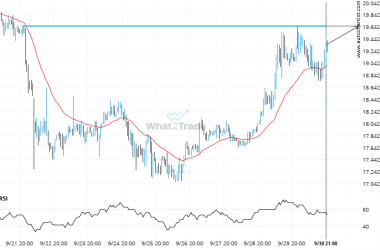
BTCCAD has broken through a support line of a Rising Wedge chart pattern. If this breakout holds true, we expect the price of BTCCAD to test 7461.9929 within the next 2 days. But don’t be so quick to trade, it has tested this line in the past, so you should probably confirm the breakout before placing any trades.
Related Posts
DASHBTC – Large moves like this tend to draw attention.
DASHBTC reached 0.0002138 after a 9.47% move spanning 10 hours.
LTCUSD is approaching a resistance line of a Inverse Head and Shoulders. It has touched this line numerous times in the last 10 days.
LTCUSD is heading towards the resistance line of a Inverse Head and Shoulders and could reach this point…
Will DASHEUR break through the resistance level it tested before?
DASHEUR is moving towards a line of 19.6500 which it has tested numerous times in the past. We…

