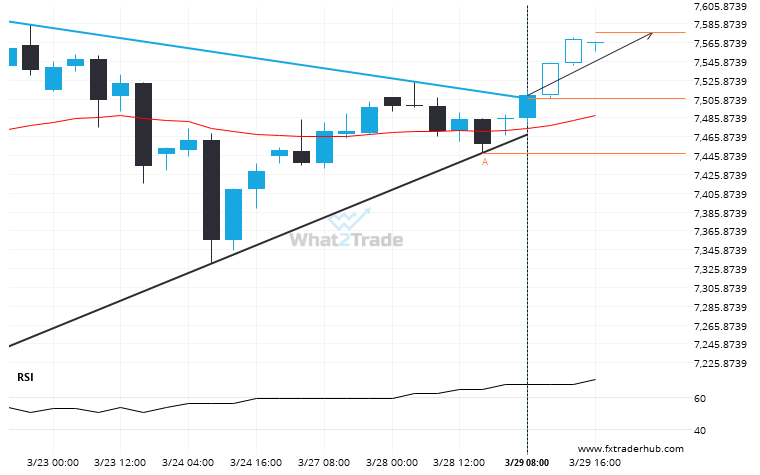
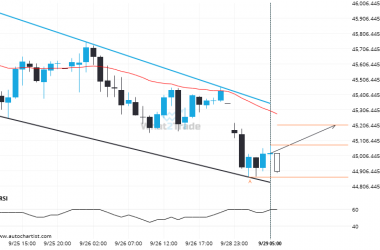
UK100 has broken through a resistance line of a Triangle chart pattern. If this breakout holds true, we may see the price of UK100 testing 7576.1694 within the next 13 hours. But don’t be so quick to trade, it has tested this line in the past, so you should confirm the breakout before taking any action.
Related Posts
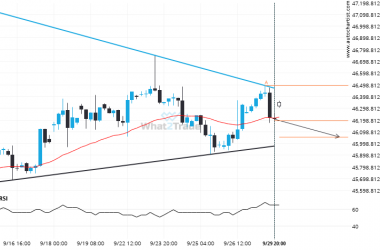
Important support line being approached by DOW 30. This price has been tested numerous time in the last 19 days
DOW 30 is moving towards a support line which it has tested numerous times in the past. We…
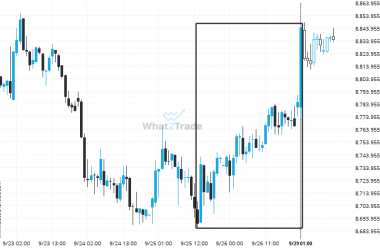
ASX 200 experienced a 1.78% bullish move in just 4 days. The magnitude speaks for itself.
ASX 200 has moved higher by 1.78% from 8689.4 to 8844.2 in the last 4 days.
A possible move on Nikkei 225 as it heads towards resistance
Emerging Channel Down pattern in its final wave was identified on the Nikkei 225 1 hour chart. After…

