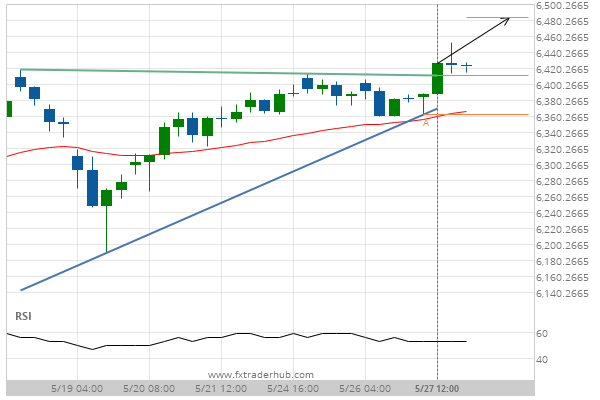
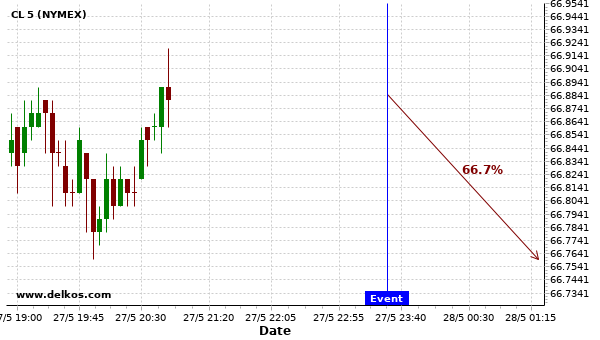
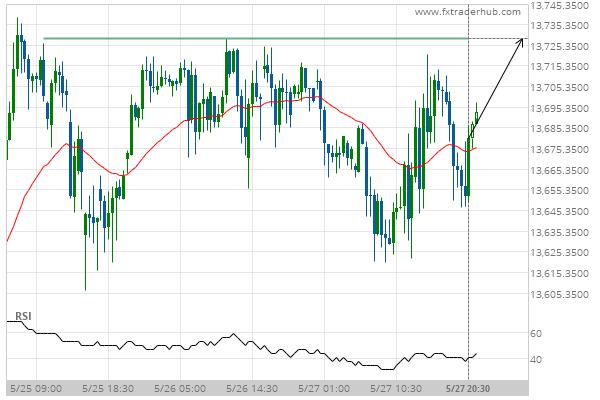
FRA40 has broken through a resistance line of a Ascending Triangle chart pattern. If this breakout holds true, we expect the price of FRA40 to test 6483.2516 within the next 2 days. But don’t be so quick to trade, it has tested this line in the past, so you should probably confirm the breakout before placing any trades.
Related Posts
Nikkei 225 reached 47590.0 after a 3.64% move spanning 3 days.
Nikkei 225 reached 47590.0 after a 3.64% move spanning 3 days.
After testing 6741.8398 numerous times, US 500 has finally broken through. Can we expect a bullish trend to follow?
The price of US 500 in heading in the direction of 6757.0430. Despite the recent breakout through 6741.8398…
NAS 100 is approaching a resistance line of a Rising Wedge. It has touched this line numerous times in the last 11 days.
NAS 100 is heading towards the resistance line of a Rising Wedge. If this movement continues, the price…

