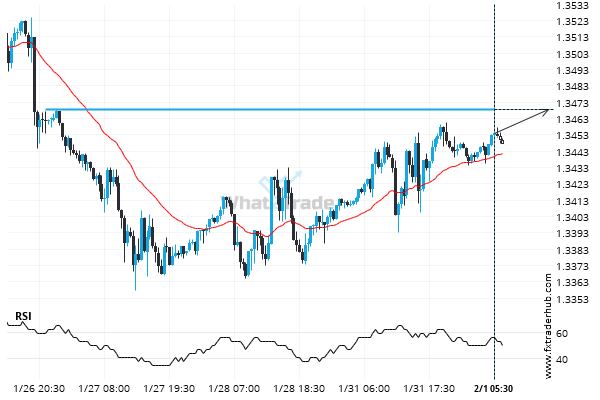
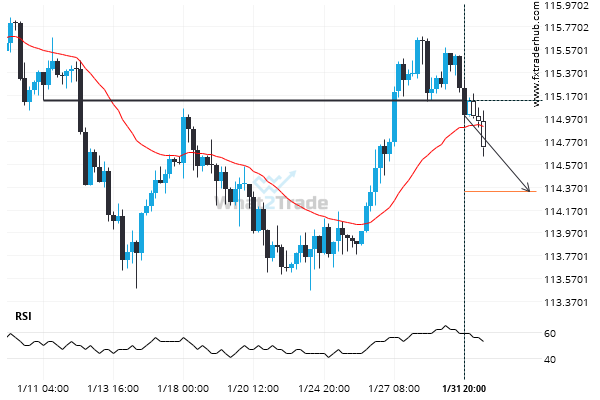
BTCUSD has broken through a resistance line of a Triangle chart pattern. If this breakout holds true, we may see the price of BTCUSD testing 41549.9940 within the next 3 days. But don’t be so quick to trade, it has tested this line in the past, so you should confirm the breakout before taking any action.
Related Posts
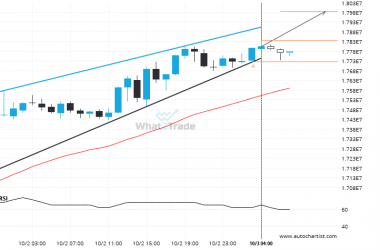
After testing the resistance line numerous times, BTCJPY is once again approaching this line. Can we expect a bullish trend to follow?
BTCJPY is moving towards a resistance line. Because we have seen it retrace from this line before, we…
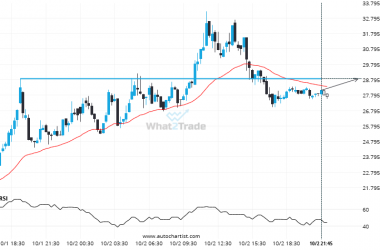
DASHEUR is quickly approaching a very important level it has previously tested numerous times in the past
The price of DASHEUR in heading back to the resistance area. It is possible that it will struggle…
Extreme movement experienced on LTCUSD. Check the chart to see what to do next.
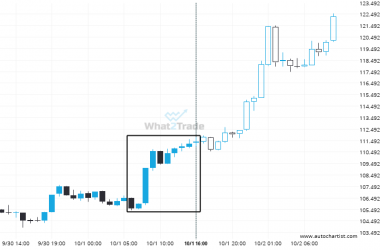
LTCUSD reached 111.36 after a 5.48% move spanning 10 hours.

