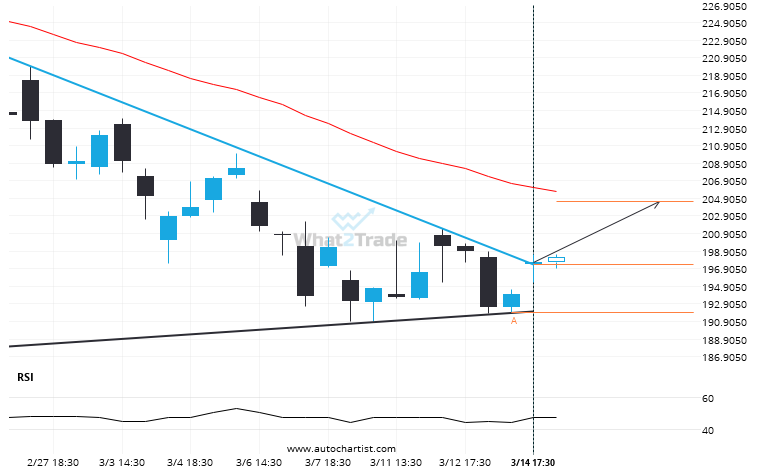
This trade setup on AMZN is formed by a period of consolidation; a period in which the price primarily moves sideways before choosing a new direction for the longer term. Because of the bullish breakout through resistance, it seems to suggest that we could see the next price move to 204.5211.
Related Posts
TSLA through 323.62452380952374. Is this a confirming a breakout? Will it continue its path in the current trend toward 369.9006?
TSLA has broken through the resistance line of a Triangle technical chart pattern. Because we have seen it…
V is approaching 338.0450. We expect either a breakout through this line, or a rebound.
V is approaching a resistance line at 338.0450. If it hits the resistance line, it may break through…
NVDA – approaching a resistance line that has been previously tested at least twice in the past
NVDA was identified at around 183.45 having recently rebounded of the support on the 1 hour data interval.…