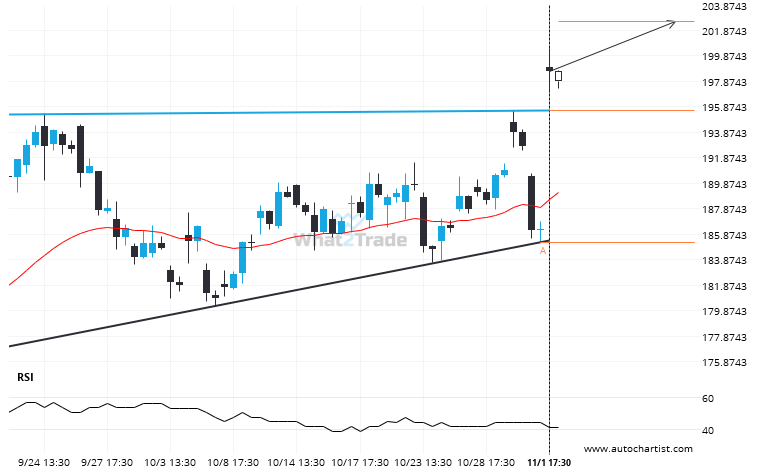
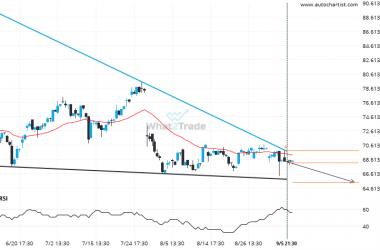
AMZN has broken through a resistance line of a Ascending Triangle chart pattern. If this breakout holds true, we may see the price of AMZN testing 202.5978 within the next 3 days. But don’t be so quick to trade, it has tested this line in the past, so you should confirm the breakout before taking any action.
Related Posts
BRK.B breakout from a Channel Up trade setup. Will it continue this trend to hit the target price?
BRK.B has broken through the support line of a Channel Up technical chart pattern. Because we have seen…
AAPL – approaching a price line that has been previously tested numerous times in the past
AAPL is about to retest a key horizontal resistance level near 238.3750. It has tested this level 4…
PYPL is approaching a support line of a Falling Wedge. It has touched this line numerous times in the last 117 days.
PYPL is heading towards the support line of a Falling Wedge. If this movement continues, the price of…

