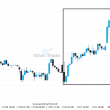
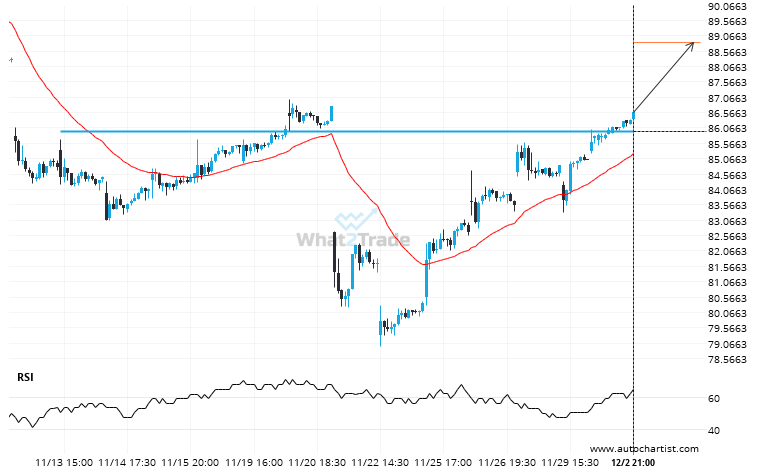
A strong resistance level has been breached at 85.9400 on the 30 Minutes BIDU chart. Technical Analysis theory forecasts a movement to 88.8350 in the next 20 hours.
Breach of 85.9400 could mean a start of a bullish trend on BIDU

A strong resistance level has been breached at 85.9400 on the 30 Minutes BIDU chart. Technical Analysis theory forecasts a movement to 88.8350 in the next 20 hours.