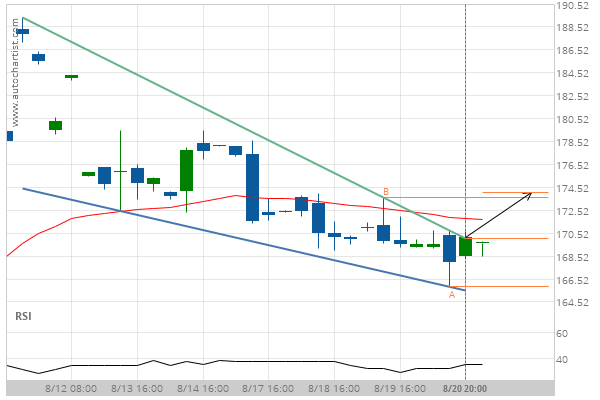
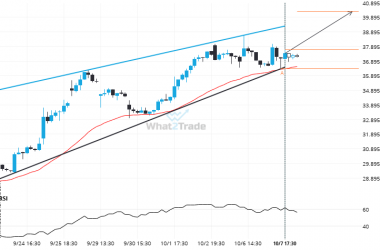
Boeing Co. has broken through the resistance line of a Pennant technical chart pattern. Because we have seen it retrace from this position in the past, one should wait for confirmation of the breakout before trading. It has touched this line twice in the last 10 days and suggests a target line to be around 174.09 within the next 2 days.
Boeing Co. – breach of a trending resistance line that has been tested at least twice before.