How many times were you certain of that one trading signal that told you that a trend was over? Or what about the one that indicted a trend was just about to begin? Of course, that “prophecy” was eventually dispelled and the market turned against you. It probably happens quite a lot, maybe even more than you’d care to admit.
Those are fake signals. That’s when you think you’re getting a clear signal, but… you aren’t. Sometimes identifying a fake trading signal can be tricky. Often, a little alertness can save you the pain of following the wrong trend. In this article, I will focus on some tips that will allow you to avert some of the more common fake signals.
Moving Average Fake Trading Signal
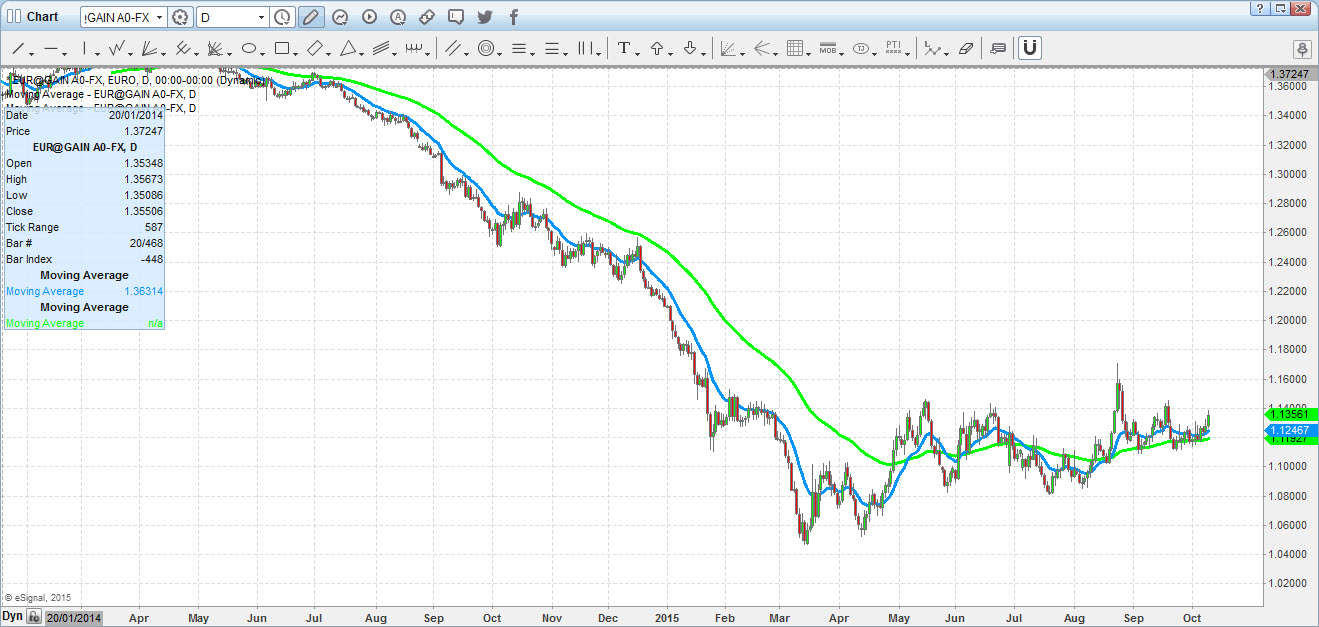
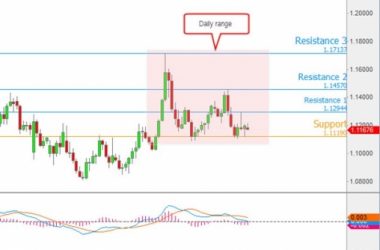
This is a classic fake trading signal. The Moving Average Cross, where the fast moving average crosses the slow moving average, signals a trend change. For this example, let’s look at the chart below. When the fast moving average (blue) crossed above the slow moving average (green) the trend didn’t change. In fact, the fast moving average later crossed the slow a few more times.
How Can You Avoid this Tricky One?
You must validate the change of trend signal with another trading signal. For example, in our sample, the pair had not broken the 1.17 resistance that caps the pair in bearish territory. We can’t expect a trend to be changed before the resistance that trims that trend has been broken.
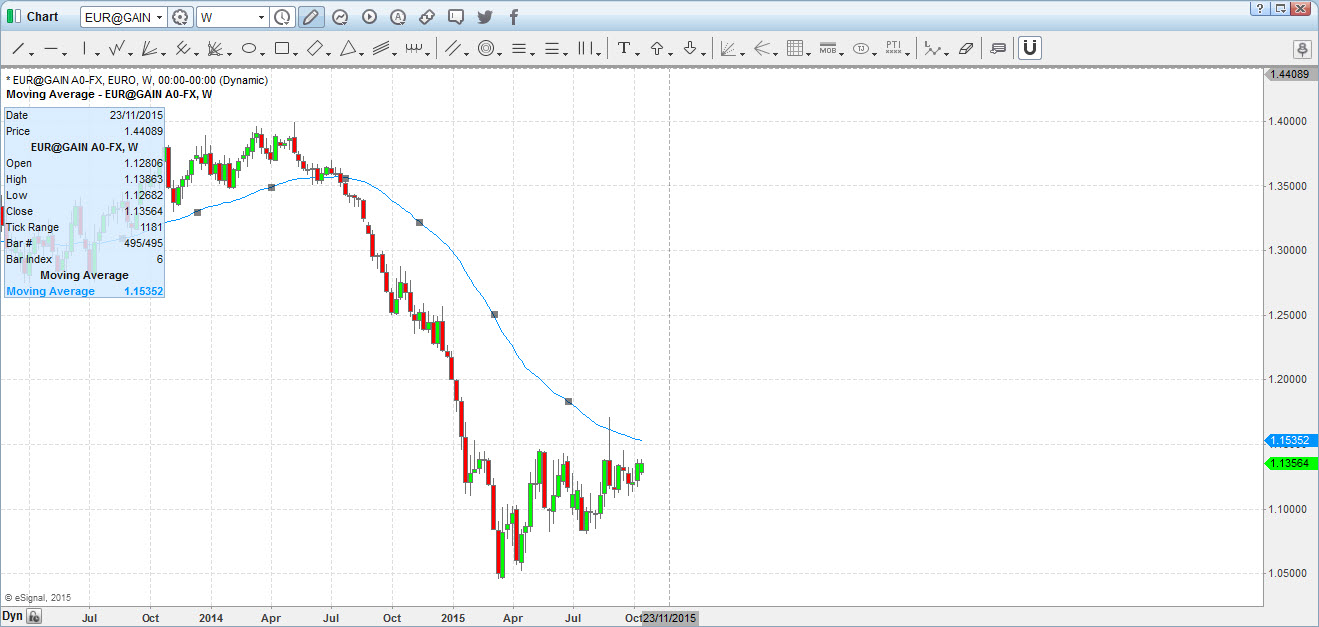
Another helpful tool would be to move one level up and run a long term EMA. In the case of weekly, 52 weeks is the most effective in giving a general indication of momentum. Again, it’s not definitive by itself.
First you need to determine if the moving average cross suggests a changing trend. Then, see if key resistance has been broken. If both have, then the pair should also trade above its 52 week EMA. As we can see, those conditions were not fulfilled. The combination of the supplemental conditions should lead to one conclusion. That is that trading signal was, indeed, a fake moving average cross signal.
The Fake Double Bottom
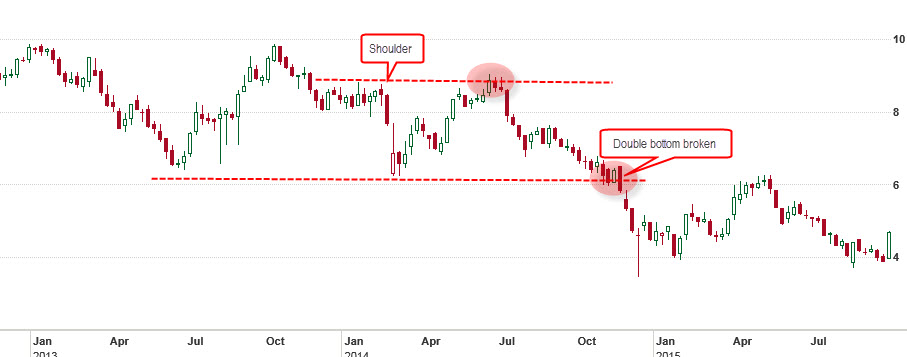
The second most common fake trading signal is the fake double bottom. The Double Bottom is a classic signal traders often rely on. When you see the pair forming that classic M shape you instinctively take the opposite trade. Then you ride out the counter bullish trend. After all, if this is a bottom, the pair can only go up right?
But as is clearly shown in the chart below, the trend didn’t change. And after reaching the shoulder (see chart) the pair flipped again into bearish and broke the support.
How to Avoid this Trap
In order for the double bottom M shape to confirm a trend change the pair must close above the shoulder. If it doesn’t, the trend is capped on a bearish momentum. Then the likelihood for the trend to continue with its bearish trajectory is high. A close above the shoulder, however, is a good validation that the trend is bottoming.
Fake Correction
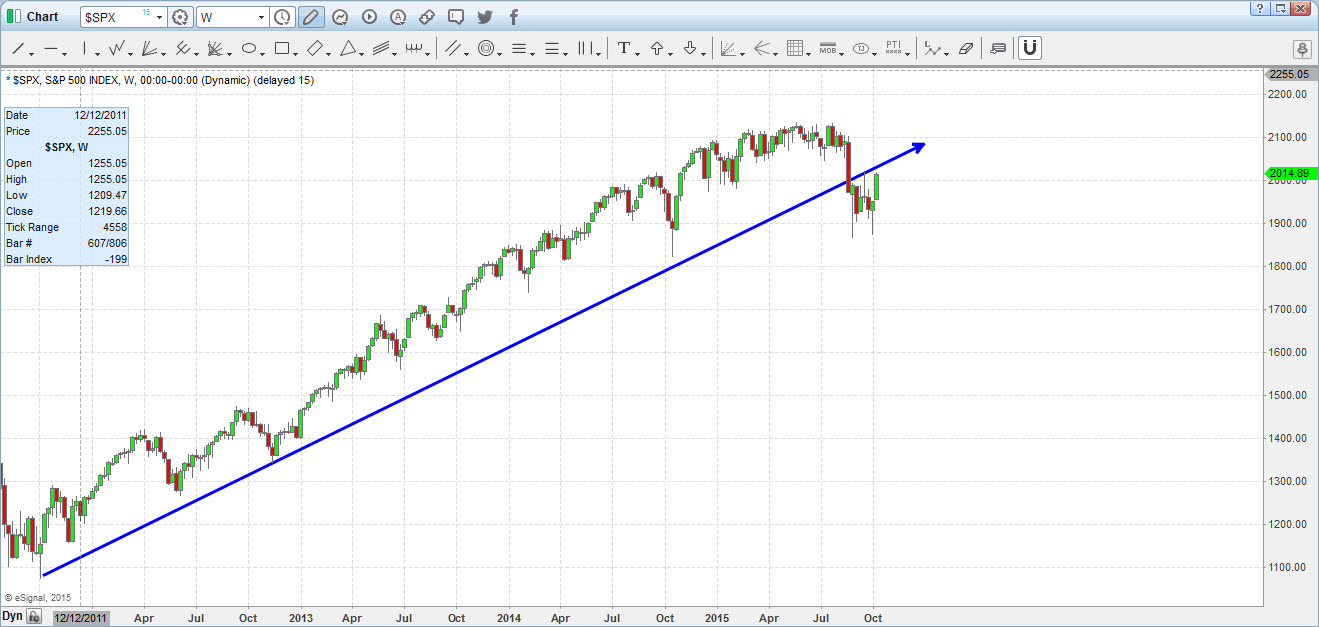
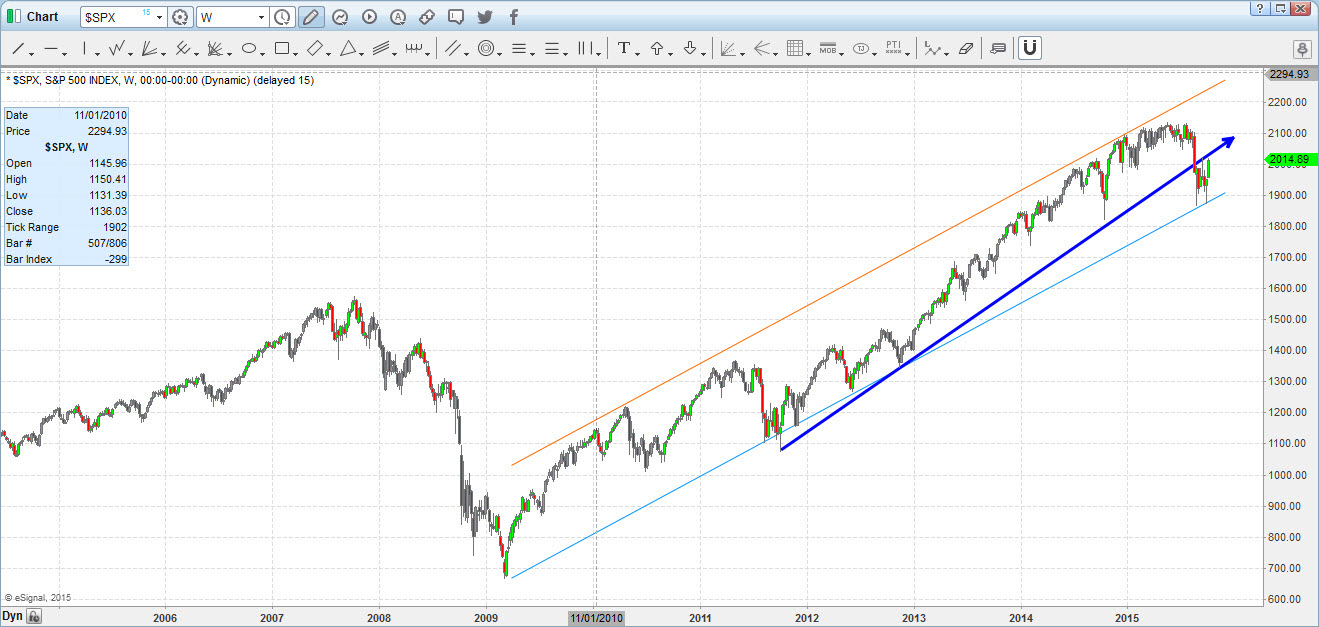
This is another classic; you get a trend line broken(in blue) and immediately conclude that the trend is going to flip. Of course, you jump on the band wagon and open a short. Later, you encounter a brick wall at support and have the bullish trend resume.
Once again, my main tip here is to go one level up. Now you can see the broader channel and clearly see that we are still within the trend. That way you save yourself from a false entry.
Fake Fibonacci
Closing out our list is a pure classic: the fake Fibonacci trading signal which is support that you mistakenly rely on. This is usually driven by human error of stretching from the wrong points.
How to avoid the Fake Fibonacci?
The Parabolic SAR is very effective at this.
In Conclusion
There are many, many more fake signals and an equal number of ways to identify them. The problem is very often you won’t be able to spot the fake. But at least, with these basic rules of thumb, you’ll get an edge up. If you can spot the obvious ones you can improve your statistics and your odds. And trading is all about tilting the odds in your favor.


