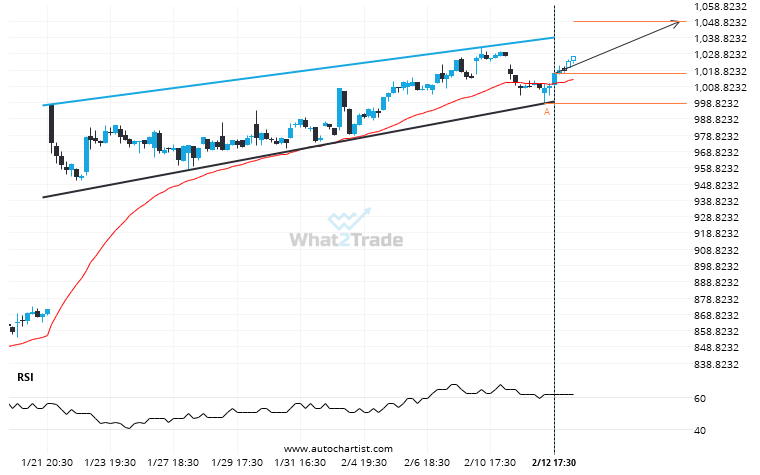
A Channel Up pattern was identified on NFLX at 1016.97, creating an expectation that it may move to the resistance line at 1048.8300. It may break through that line and continue the bullish trend or it may reverse from that line.
Related Posts
NVDA is quickly approaching a very important level it has previously tested numerous times in the past
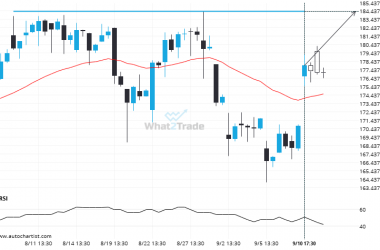
NVDA is heading towards 184.4200 and could reach this point within the next 15 hours. It has tested…
GOOGL formed a Channel Up on the 1 hour chart. Retest of resistance in sight.
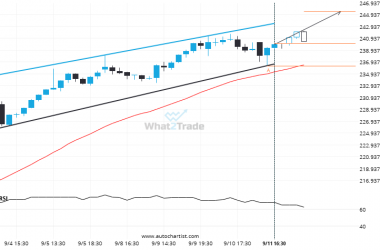
GOOGL is heading towards the resistance line of a Channel Up and could reach this point within the…
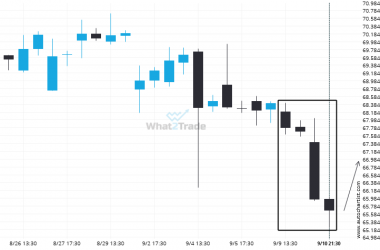
PYPL moves lower to 65.6650 in the last 2 days.
Rare candle sequence recorded on the PYPL 4 hour chart, ending at 65.6650.

